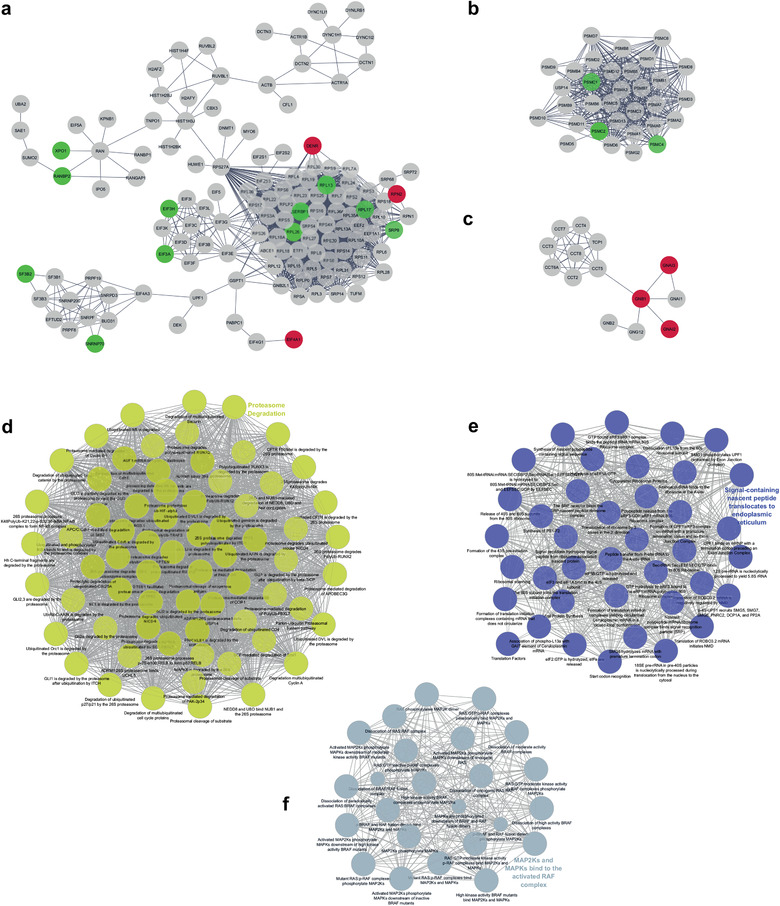
FIGURE 8.

Protein‐protein interaction network of shared proteins by SG1 and SG2. In these subnetworks, the proteins enriched in SG1 are represented as red dots and those enriched in SG2 as green dots. (a) Main subnetwork containing functional modules associated with translation and metabolism of RNA, (b) protein degradation, and (c) protein folding. The main biological processes were related to proteasome degradation (d), translational modulation (e), and MAP2K and MAPK activity (f). The network analysis was performed with the STRING software (https://string‐db.org). The network considers reported physical interactions of the 1400 proteins identified in both SG1 and SG2
