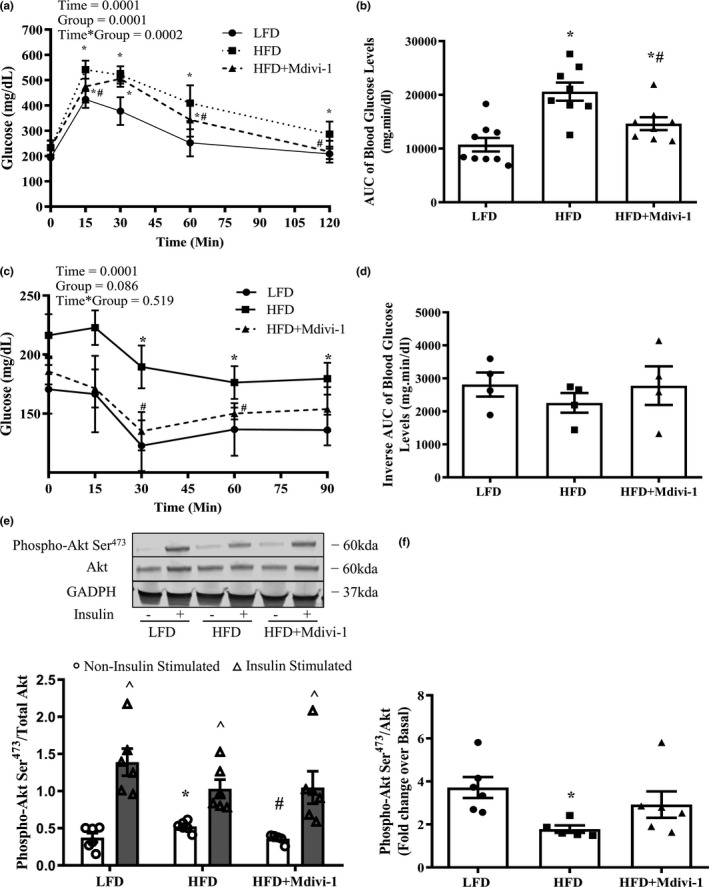
FIGURE 1.

GTT, ITT, and skeletal muscle insulin signaling in mice fed either a LFD or HFD with or without Mdivi‐1 treatment. (a) Blood glucose levels during GTT test; (b) Blood glucose area under the curve (AUC) during GTT test; (c) Blood glucose levels during ITT test; (d) Inverse glucose area under the curve (AUC) during ITT test; (e) Phosphorylation of Akt Ser473/Akt under Non‐insulin stimulated and Insulin‐stimulated conditions; (f) Fold change in Akt Ser473 phosphorylation/total Akt under Insulin‐stimulated condition over Non‐insulin stimulated condition. Data are presented as mean ± SEM. n = 4–9/group. *p < 0.05 versus LFD, # p < 0.05 versus HFD, ^p < 0.05 versus respective Non‐insulin stimulated condition
