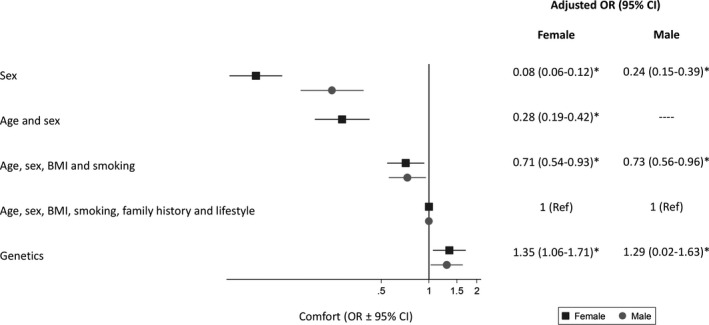
Figure 4.

Odds (OR ± 95% confidence intervals) of being comfortable with waiting until older if low risk based on different characteristics, adjusting for age, sex, level of education and social class and clustering of response by participant. The ORs represent the association between a 1‐point increase in comfort (measured on a Likert scale from 1 indicating not at all comfortable to 7 indicating extremely comfortable) and the approach to determining risk. * P < .05 compared with using age, sex, BMI, smoking, family history and lifestyle
