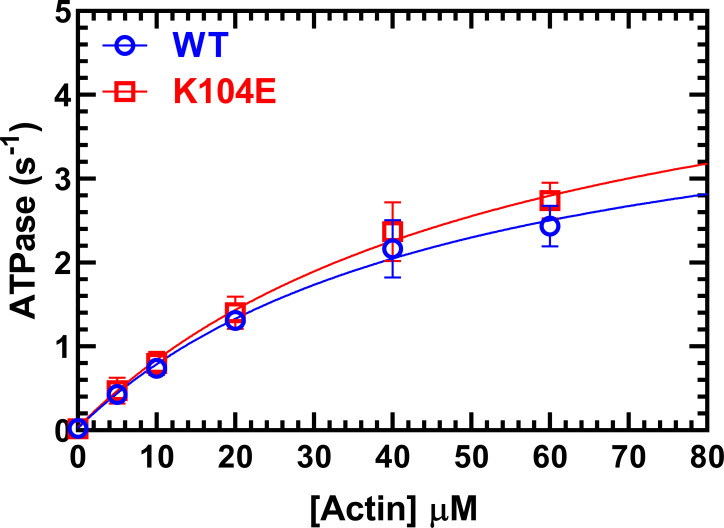
Figure 3.
Actin-activated ATPase. The actin-activated ATPase activity of M2β-S1 WT RLC versus K104E RLC (0.1 µM) was examined as a function of actin concentration in MOPS 20 buffer at 25°C. The ATPase activity is plotted as a function of actin concentration and fit to a hyperbolic relationship to determine maximal ATPase and actin concentration at which ATPase is one-half maximal. The results represent an average of three experiments from three protein preparation (mean ± SD). See Table 1 for a summary of ATPase parameters.

