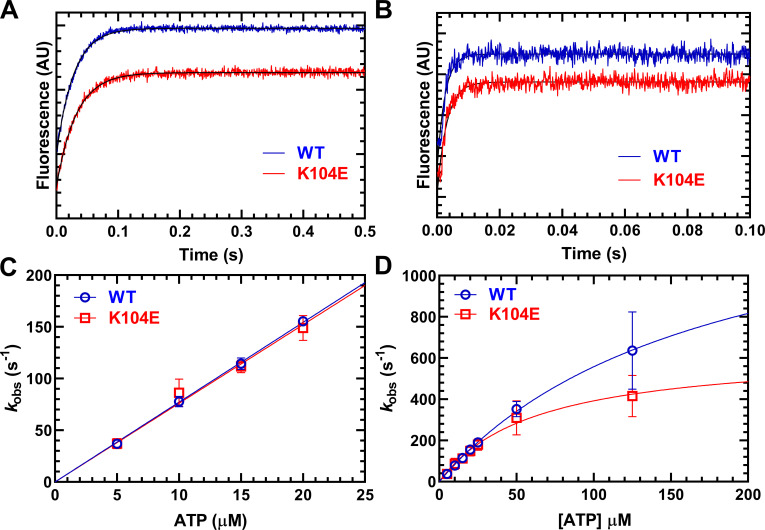
Figure 4.
ATP-induced dissociation from actin. The experiment was performed by mixing a complex of M2β-S1 and pyrene actin with increasing concentrations of ATP (5–125 µM). (A and B) The fluorescence transients were best fit by a single exponential function at all ATP concentrations. Representative fluorescence transients at 5 µM ATP (A; kobs = 36.0 ± 0.2 and 31.1 ± 0.3 s–1 in WT and K104E, respectively) and 125 µM ATP (B; kobs = 553.6 ± 18.5 and 403.3 ± 12.0 s–1 in WT and K104E, respectively). (C) The second-order rate constant K’1Tk’+2 was determined from the linear-dependence on ATP concentration at low ATP concentrations (5–20 µM). (D) The maximal rate of ATP-induced dissociation (k’+2T) was determined from the hyperbolic fit of kobs as a function of ATP concentration. AU, arbitrary unit.

