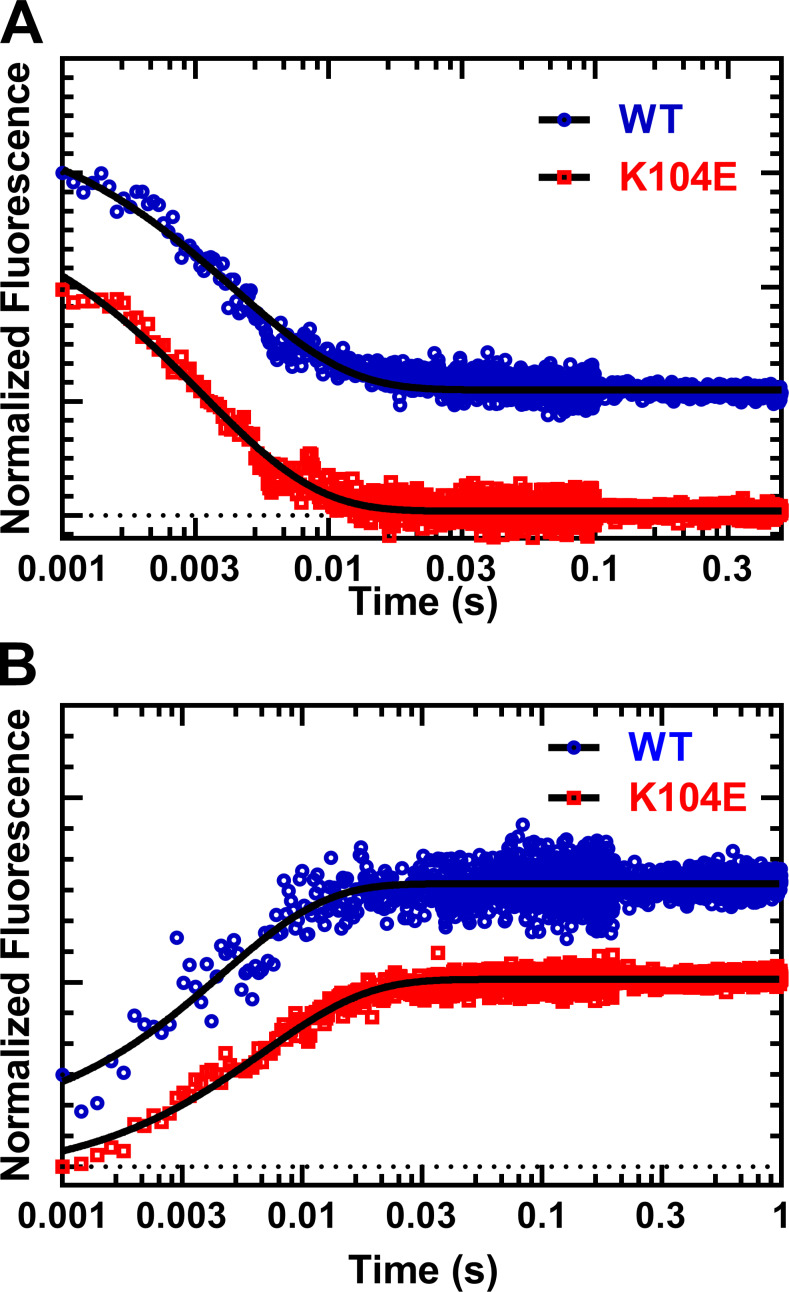
Figure 5.
ADP-release from actomyosin. Representative fluorescence transients of ADP release experiments using mantADP or pyrene actin. (A) We monitored mantADP dissociation by mixing acto–M2β-S1 complexed with mantADP with saturating ATP (1 mM), and the fluorescence transients were fit to a single exponential function (WT, kobs = 228.3 ± 3.8 s–1, and K104E, kobs = 297.5 s–1). (B) We examined ADP dissociation by mixing pyrene acto–M2β-S1.ADP with saturating ATP (2 mM), and the fluorescence transients were fit to a single exponential function (WT, kobs = 215.8 ± 8.9 s–1, and K104E, kobs = 145.0 ± 2.5 s–1).

