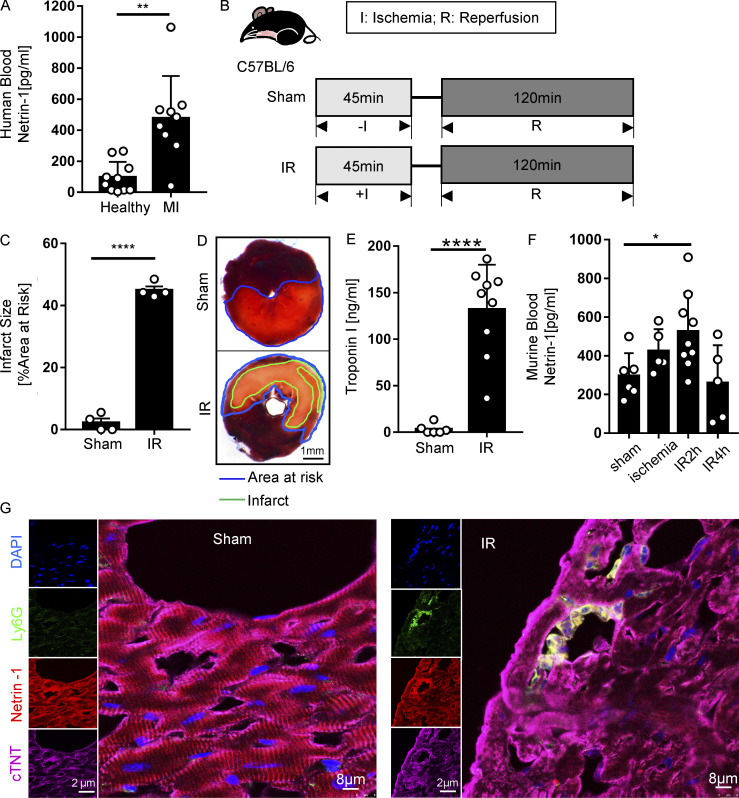
Figure 1.
Blood netrin-1 increases in MI patients and mice with myocardial IR surgery. (A) Blood netrin-1 levels of healthy donors and MI patients (n = 10 for healthy control, n = 9 for MI; two-tailed Welch’s t test). (B) Experimental strategy for the murine myocardial IR model. (C) Infarct sizes of IR group compared with the sham group (n = 4 per group; two-tailed unpaired t test). (D) Representative infarct staining results for the IR model. The infarct area is outlined by a green line; the blue line marks the AAR (scale bar = 1 mm). (E) cTnI levels after surgery (n = 6 for sham group, n = 9 for IR group; two-tailed Welch’s t test). (F) Murine blood netrin-1 levels were measured in sham, ischemia (45 min), IR2h (45 min of ischemia + 2 h of reperfusion), and IR4h (45 min of ischemia + 4 h of reperfusion) groups (n = 6 for sham group, n = 5 for ischemia group, n = 9 for IR2h group, and n = 5 for IR4h group; one-way ANOVA with Bonferroni post hoc tests). (G) Immunofluorescence costaining of netrin-1 with cTnT and Ly6G in WT mice after sham or IR surgery shows netrin-1 in cardiomyocytes and neutrophils. (For single-channel pictures, scale bar = 2 µm; for merged channel pictures, scale bar = 8 µm.) *, P < 0.05; **, P < 0.01; ****, P < 0.0001. Data are presented as mean ± SD.

