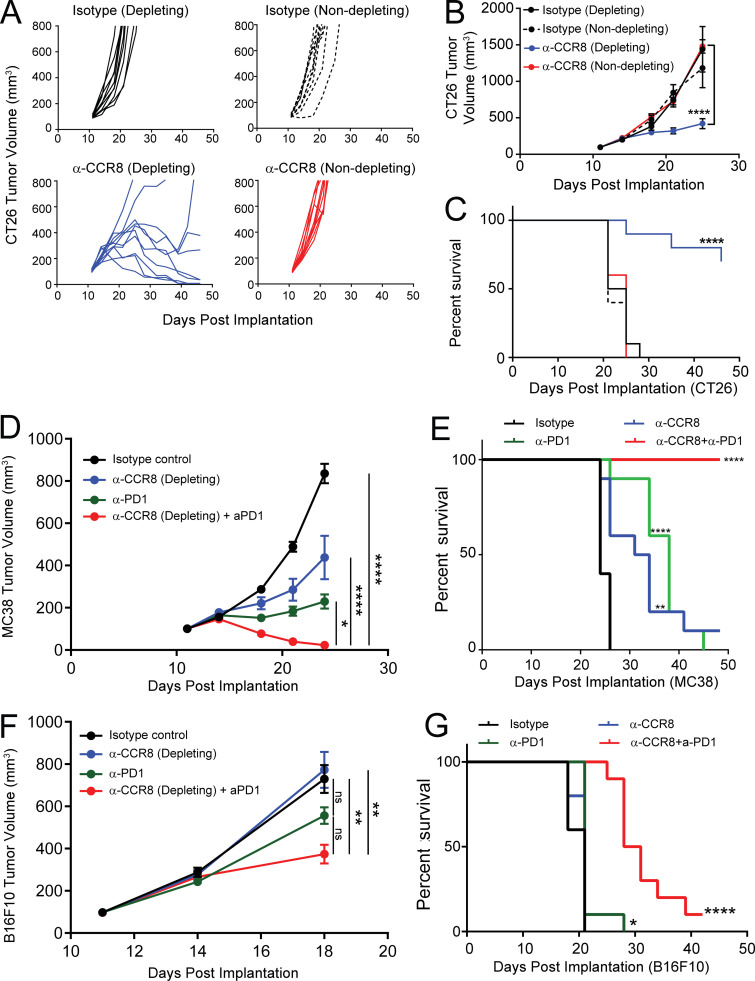
Figure 10.
Antitumor activity of targeting CCR8 expression on tumor-infiltrating T reg cells. (A) CT26 tumor growth curves of animals treated with CCR8-specific depleting and nondepleting antibodies, along with depleting and nondepleting isotype controls (top). (B and C) Averaged tumor growth (B) and overall survival of animals (C) treated as in A. (D) Averaged tumor growth curves of MC38 tumors treated with isotype control, anti-CCR8, anti–PD-1, or combination. (E) Overall survival of MC38 tumor bearing mice treated in D. (F) Averaged tumor growth curves of B16F10 tumors treated with Isotype control, anti-CCR8, anti–PD-1, or combination. (G) Overall survival of B16F10 tumor-bearing mice treated in F (****, P < 0.0001; ***, P < 0.0002; **, P < 0.002; *, P < 0.05; two-way ANOVA with Tukey’s post-hoc for tumor growth inhibition and Mantel-Cox log rank test for survival curve analysis).

