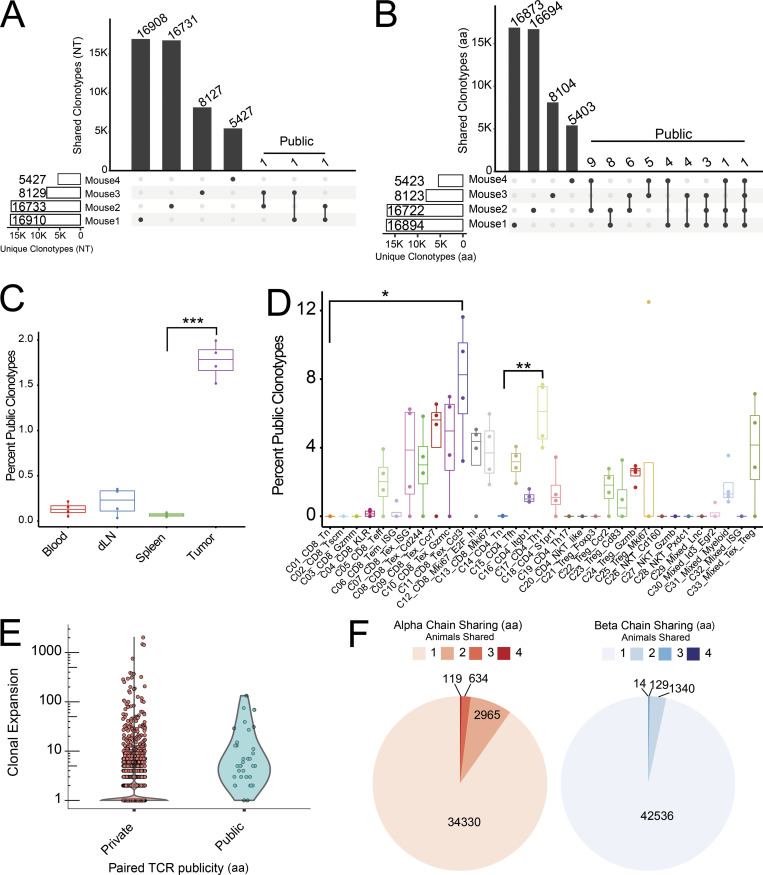
Figure 3.
Analysis of public TCRs. (A and B) Numbers of private and public nucleotide (NT; A) and amino acid (AA; B) levels of TCR clonotypes. Clonotypes shared by more than one mouse are marked as public. (C and D) Public aa-level clonotypes as a percentage of all aa clonotypes within each tissue (C) and phenotypic cluster for each mouse (n = 4; D). Paired Student’s t test was applied to determine the significance between clusters and tissues in C and D. ***, P < 0.001; **, P < 0.01; *, P < 0.05. (E) Clonal expansion of tumor T cells between private and public aa-level clonotypes. (F) Sharing of individual TCR chains displayed as proportions. dLN, draining LN.

