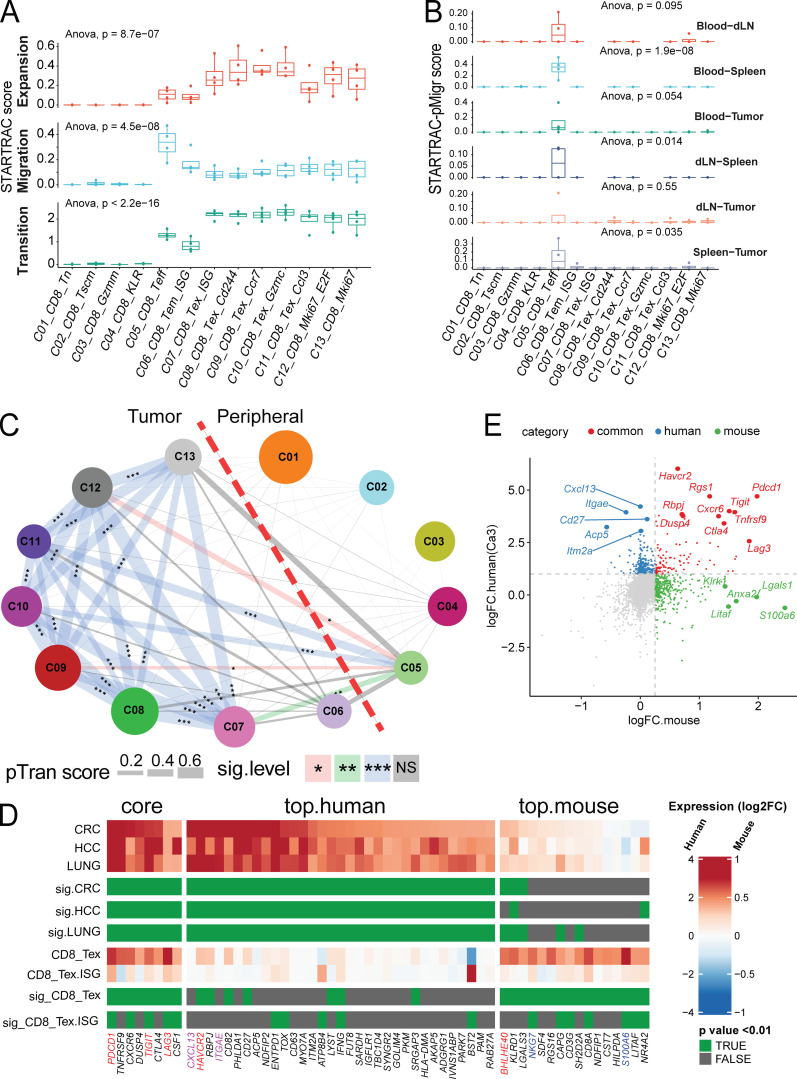
Figure 6.
STARTRAC analysis of CD8+ clusters. (A) Clonal expansion, cross-tissue migration, and phenotypic transition scores for all CD8+ clusters quantified by STARTRAC for each animal (n = 4). Significance calculated by ANOVA. (B) Pairwise migration between tissue pairs of CD8+ clusters quantified as a STARTRAC pMigr score. (C) Cross-cluster phenotypic transition scores for all combined animals. P values calculated by permutation of clusters to determine significance of pairwise cluster sharing. ***, P < 0.001; **, P < 0.01; *, P < 0.05. (D) Gene signature comparison between human and mouse Tex cells. Mouse CD8+ clusters C08-C11 were combined into CD8_Tex and compared against all other clusters, while human Tex from previous human findings (Guo et al., 2018; Zhang et al., 2018; Zheng et al., 2017) were compared with non-Tex clusters. Gene expression from both species are displayed as log2FC (color bar) with adjusted P value (green). Homologous genes are classified as human or mouse enriched genes based on adjusted P value of < 0.01 and log2FC > 1.5 (human) or P value < 0.01 and log2FC > 0.3 (mouse). Genes enriched in both species are indicated as core. (E) Correlation of key marker genes between aggregated mouse Tex clusters C08-C11 and aggregated human Tex clusters from three human cancers labeled in D as Ca3. Gene expression fold change of genes over other clusters by species are plotted, with common markers highlighted in red, mouse specific in green, and human specific in blue. dLN, draining LN; HCC, hepatocellular carcinoma.

