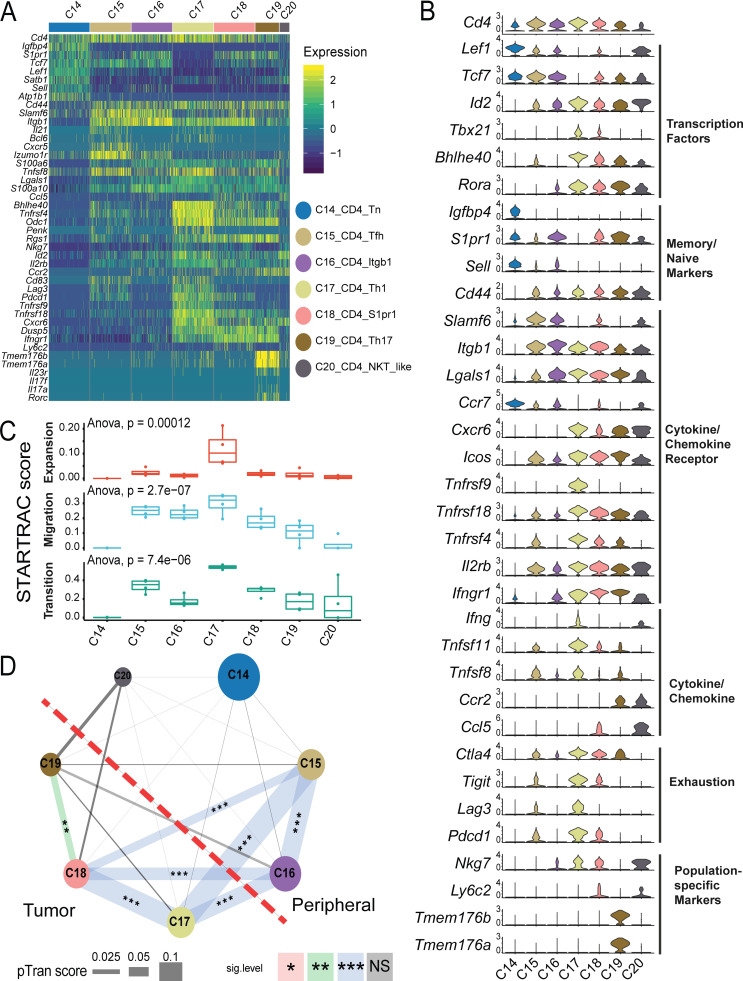
Figure 7.
Gene expression and STARTRC analysis of CD4+ effector clusters. (A) Heatmaps of all CD4+ clusters C14-C20. (B) Violin plots of key marker genes. (C) Clonal expansion, cross-tissue migration, and phenotypic transition scores for CD4+ clusters quantified by STARTRAC for each animal (n = 4). Significance calculated by ANOVA. (D) Cross-cluster phenotypic transition scores between CD4+ clusters for all animals combined. P values calculated by permutation of clusters to determine significance of pairwise cluster sharing. ***, P < 0.001; **, P < 0.01; *, P < 0.05.

