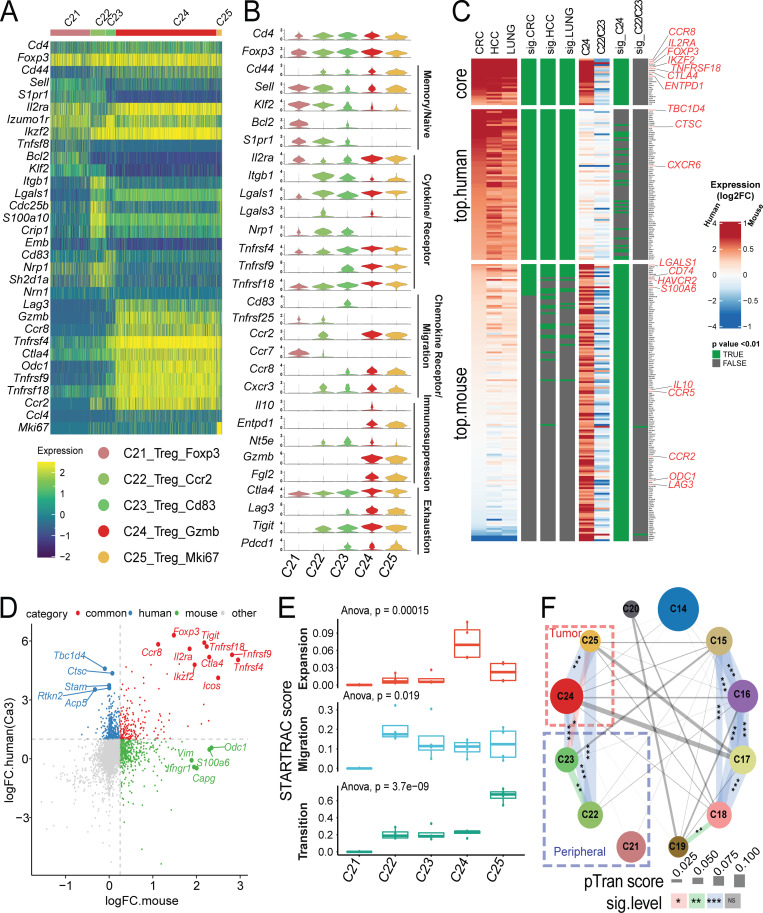
Figure 8.
Gene expression and STARTRC analysis of Foxp3+ T reg cells. (A) Heatmaps of all Foxp3+ clusters C21-C25. (B) Violin plots of key marker genes. (C) Gene signature comparison between human and mouse T reg cell cells. Mouse T reg cell clusters C24 and the combination of C22/23 clusters, while human T reg cell from previous human studies (Guo et al., 2018; Zhang et al., 2018; Zheng et al., 2017) were compared with non–T reg cell clusters. Gene expression from both species are displayed as log2FC (color bar) with adjusted P value (green). Homologous genes are classified as human or mouse enriched genes based on adjusted P value of < 0.01 and log2FC > 1.5 (human) or P value < 0.01 and log2FC > 0.3 (mouse). Genes enriched in both species are indicated as core. Notable genes are highlighted in red. (D) Correlation of genes between human and mouse-derived tumor T reg cells. Fold change of genes over non–T reg cell clusters are plotted, with top 10 common and top 5 species-specific genes highlighted. Human data are taken as an average of tumor T reg cell clusters shown in C. (E) Clonal expansion, cross-tissue migration, and phenotypic transition scores for T reg cell clusters quantified by STARTRAC for each animal (n = 4). Significance calculated by ANOVA. (F) Cross-cluster phenotypic transition scores between CD4+ and Foxp3+ clusters for all animals combined. P values calculated by permutation of clusters to determine significance of pairwise cluster sharing. ***, P < 0.001; **, P < 0.01; *, P < 0.05. HCC, hepatocellular carcinoma.

