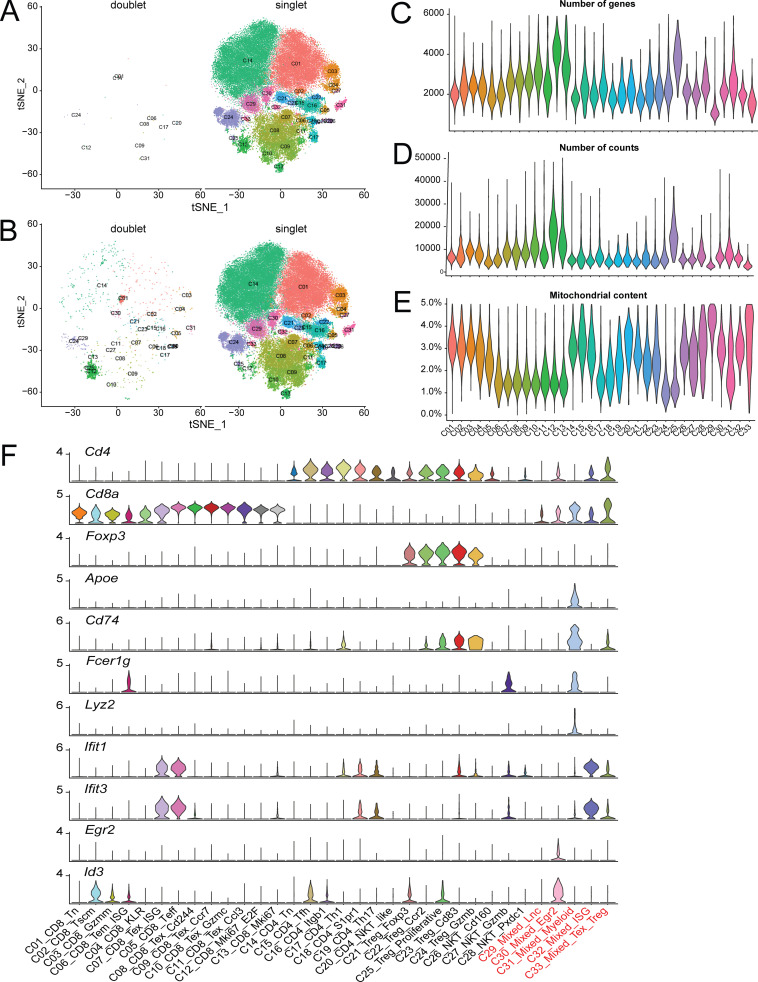
Figure S2.
Quality measurements of single-cell clusters. (A and B) Analysis of putative doublets using Scrublet (A) or DoubletDetection (B) packages. Doublets are shown in the respective left panels and singlets in the right panels. (C–E) Violin plots of unique genes (C), transcripts (D), and mitochondrial transcript percentage (E). (F) Violin plots of key T cell, B cell, and myeloid cell marker gene expression across all clusters.

