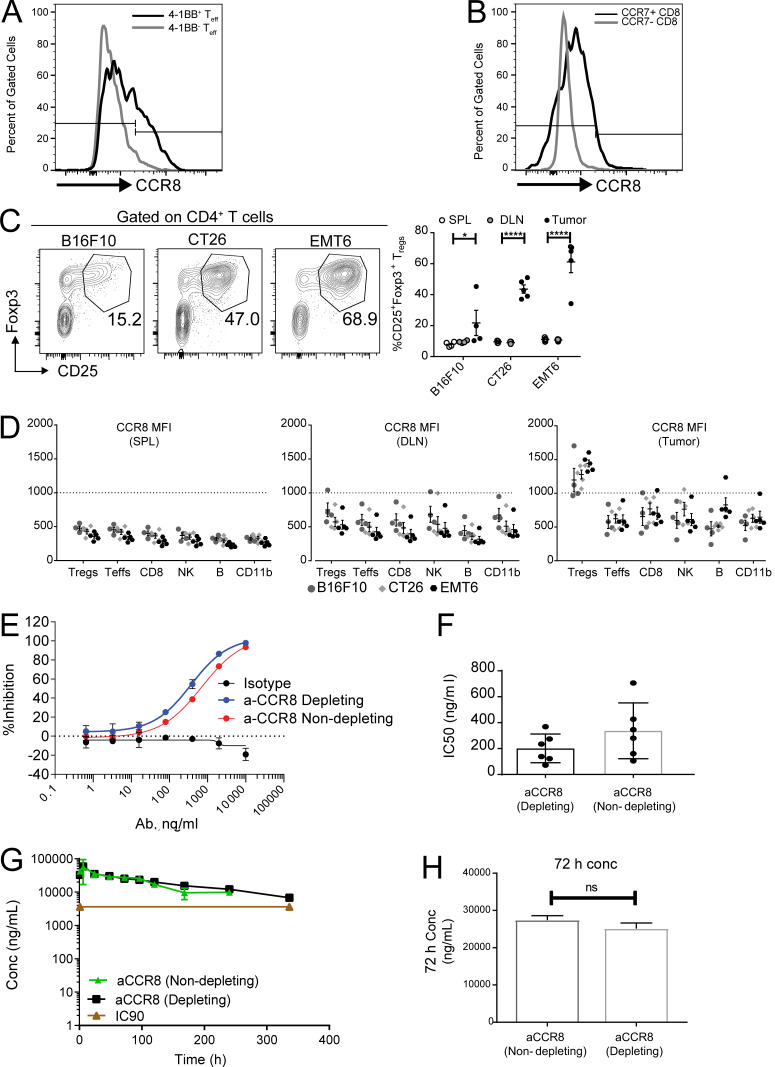
Figure S5.
CCR8 expression in tumor T reg cells and characterization of anti-CCR8 antibodies. (A) Representative histogram plot depicting expression of CCR8 on 4-1BB+ and 4-1BB− CD4+Foxp3− TEFF population in MC38 tumors. (B) Representative histogram plot depicting expression of CCR8 on CCR7+ and CCR7−CD8+ T cells in MC38 tumors. (C) Flow cytometry analysis of tumor-infiltrating T reg cells across multiple mouse tumor models shown as representative FACS plots (left) and frequencies in tumors and peripheral lymphoid organs (right). *, P = 0.0250; ****, P < 0.0001; two-way ANOVA with Tukey’s post-hoc analysis. (D) Flow cytometry analysis of CCR8 expression on immune cell types (Foxp3+ T reg cells, Foxp3− T effectors, CD8+, NKp46+ NK, CD19+ B, and CD11b+) in tumors and peripheral lymphoid tissues across tumor models. (E) In vitro chemotaxis assay evaluating the ability of CCR8-depleting and -nondepleting antibodies to block 100 pM CCL1-induced chemotaxis. (F) Bar graph comparing IC50 values from the chemotaxis assay testing CCR8-depleting and -nondepleting antibodies (n = 6). (G) Pharmacokinetic assessment of serum antibody concentration after single-dose administration of CCR8-depleting and -nondepleting antibodies (10 mg/kg i.p.). (H) Serum concentration at 72 h of animals treated as in G. DLN, draining LN; SPL, spleen; MFI, mean fluorescence intensity.

