Figure S2.
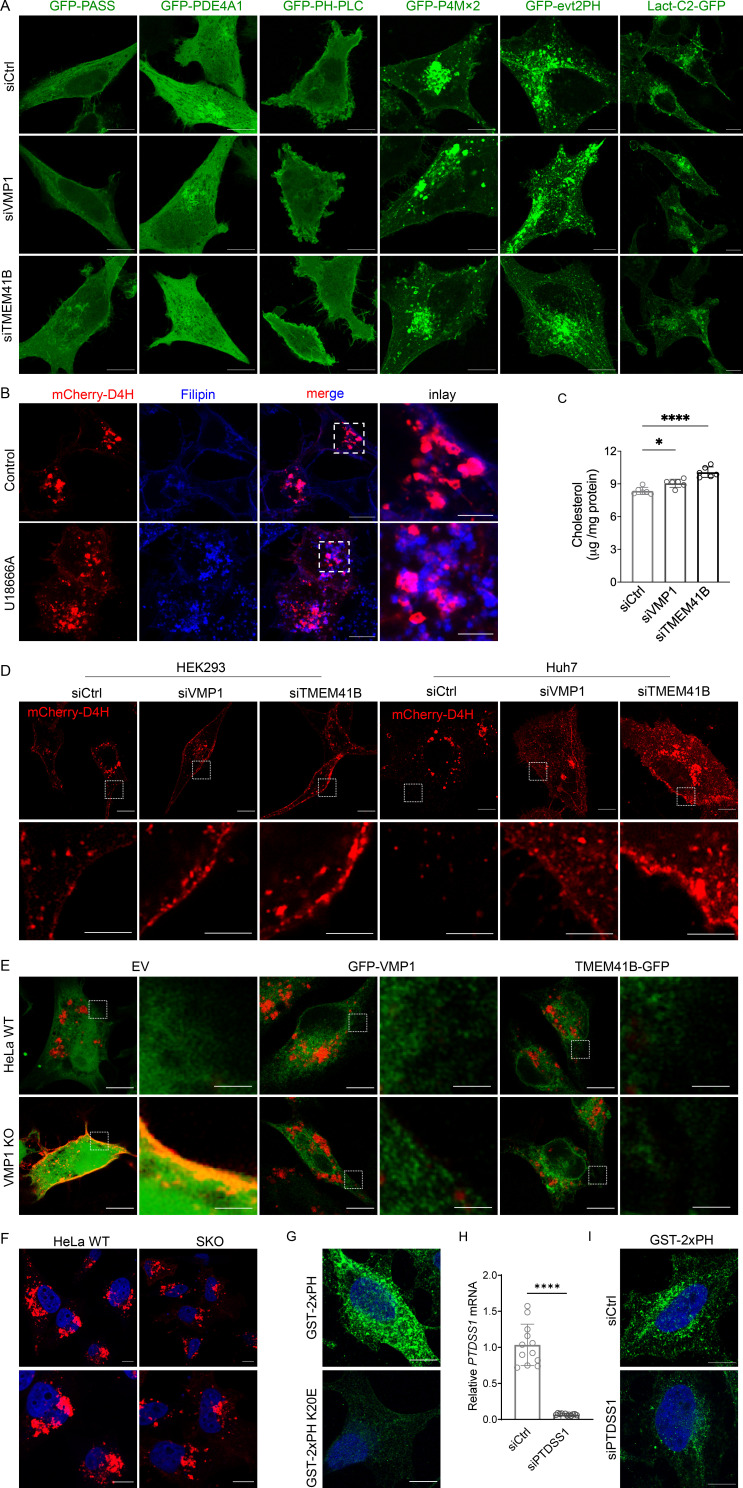
Supporting data and controls for cholesterol and PS detection. (A) Confocal images of indicated lipid sensors in HeLa cells treated with control, VMP1, or TMEM41B siRNAs. (B) Confocal images of mCherry-D4H in HeLa cells in the absence or presence of U18666A. Cellular cholesterol was stained with filipin. (C) Cholesterol content measured by Amplex Red assay in cells treated with control, VMP1, or TMEM41B siRNAs. Values were normalized to total cellular proteins. *, P < 0.05; ****, P < 0.0001 (one-way ANOVA, mean ± SD, n = 6). (D) Confocal images of mCherry-D4H in HEK293 and Huh7 cells treated with control, VMP1, or TMEM41B siRNAs. Cells were treated with siRNA for 24 h followed by the transfection of mCherry-D4H cDNA for 24 h. Inset images show the labeling of the plasma membrane by mCherry-D4H. (E) Confocal images of coexpressed mCherry-D4H and GFP empty vector (EV), GFP-VMP1, or TMEM41B-GFP in VMP1 KO HeLa cells. Inset images show the difference of the plasma membrane labeling by mCherry-D4H. (F) Confocal images of mCherry-D4H in HeLa WT and SKO cells. (G) PS labeling by GST-2xPH or GST-2xPH K20E (deficient in PS binding) in digitonin-permeabilized HeLa cells. (H) Quantitative RT-PCR analysis of HeLa cells treated with control or PTDSS1 siRNAs for 48 h. ****, P < 0.0001 (unpaired t test, mean ± SD, n = 12). (I) PS labeling by GST-2xPH in digitonin-permeabilized HeLa cells treated with control or PTDSS1 siRNAs for 48 h. Scale bars = 10 µm (inset scale bars in B and D = 4 µm and in E = 2 µm). Ctrl, control.

