Figure 2.
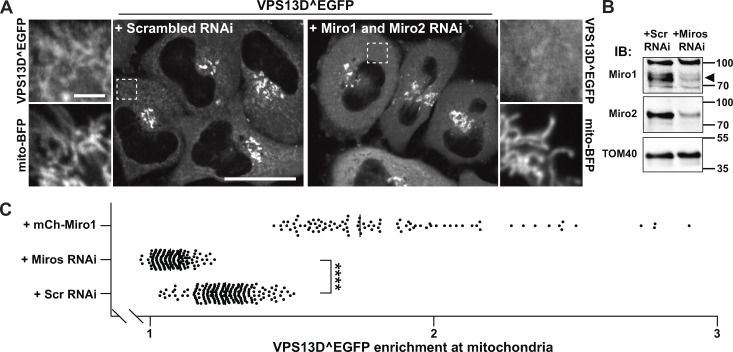
Miro is required for VPS13D recruitment to mitochondria. (A) Confocal images of HeLa cells showing the moderate recruitment of VPS13D^EGFP to mitochondria in control cells (left panel) and the loss of such signal upon knockdown of the two Miro genes via RNAi (right panel). Areas enclosed by stippled white rectangles are shown at higher magnification next to the main field, and they also show the localization of the mitochondrial marker mito-BFP. Scale bars, 30 µm in the main panel and 3 µm in the insets. (B) Immunoblot (IB) of mitochondrial fractions from HeLa cells showing the decrease of Miro1 and Miro2 levels upon RNAi treatment. Sizes in kD are indicated next to the blot. The black arrowhead indicates the Miro1 band. (C) Quantification of VPS13D^EGFP enrichment at mitochondria in control conditions and upon Miro knockdown or overexpression. The signal from mito-BFP was first used to generate a mitochondrial mask and a mask profiling a thin (1-pixel wide) cytosolic area surrounding mitochondria; the intensity from EGFP was then measured within each of these masks, and, for each cell analyzed, the ratio between these two measurements was plotted on the graph. Number of cells analyzed for scrambled (Scr) RNAi, Miro RNAi, and mCh-Miro1 conditions are 204, 204, and 96, respectively. ****, P < 0.0001 (Welch’s corrected ANOVA with Games-Howell's post hoc test).

