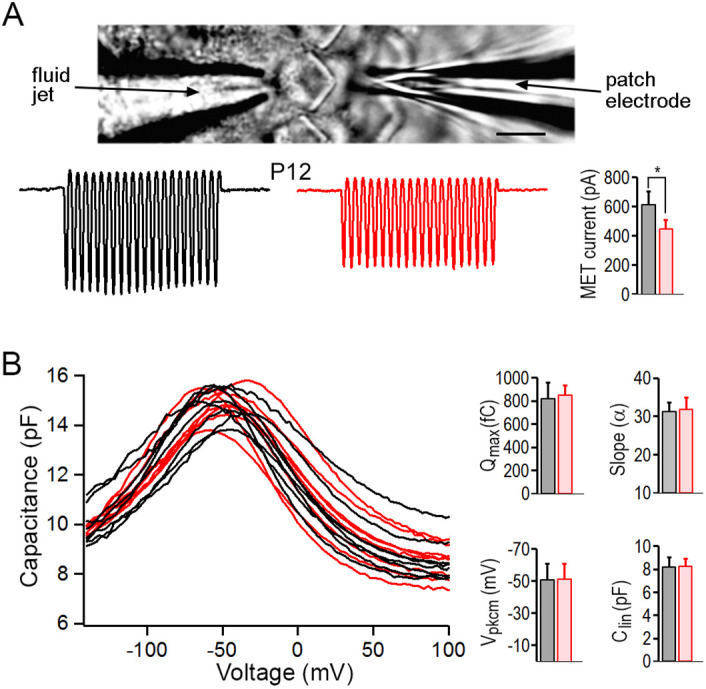
Fig. 5.

OHC function examined using whole-cell voltage-clamp technique. (A) Recording of MET current in vitro and representative MET current recorded from OHCs in lower apical turn of Lbh−/− (red) and Lbh+/+ (black) mice at P12. *P<0.05. Scale bar: 5 µm. (B) NLC measured from 9 and 8 OHCs in the lower apical turn of Lbh−/− (red) and Lbh+/+ (black) mice, respectively, at P12. Curve fitting using a two-states Boltzmann function yielded four parameters: Qmax; slope (α); Vpkcm; and Clin. Data are mean±s.d. P=0.29, 0.33, 0.47 and 0.42, respectively, for the four parameters (one-tailed distribution, two-sample unequal variance Student's t-tests).
