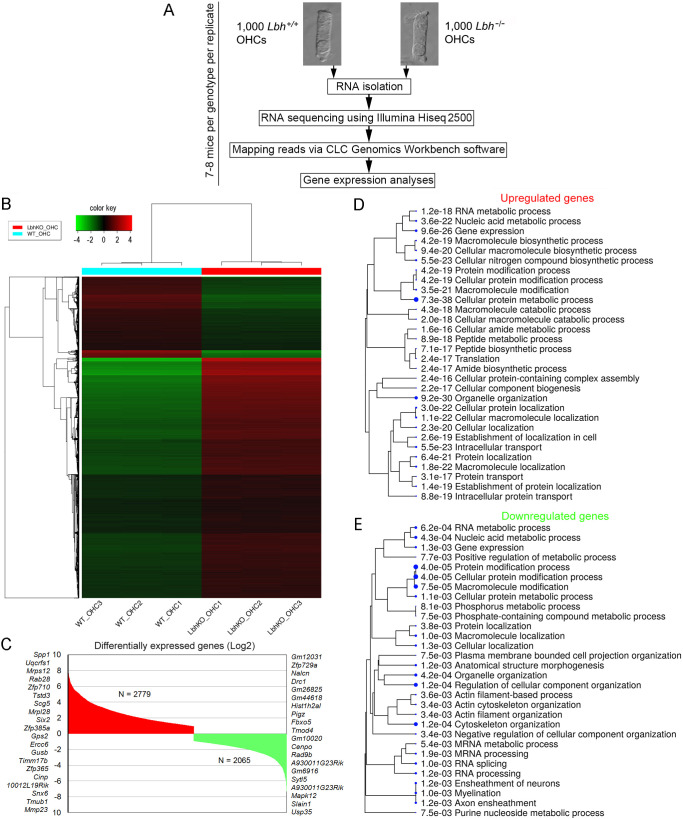
Fig. 6.
RNA-seq transcriptome analysis of Lbh−/− and Lbh+/+ OHCs. (A) Workflow of the experimental design for RNA-seq analysis of OHCs isolated from Lbh−/− and Lbh+/+ mice. (B) Euclidean distance heatmap of 10,000 genes (z-score cutoff=4), depicting the average linkage between genes expressed in Lbh−/− and Lbh+/+ OHCs. (C) Upregulated and downregulated genes in Lbh−/− compared to Lbh+/+ OHCs. The top 20 genes upregulated or downregulated are shown on either side of the plot. (D) ShinyGO biological processes enriched in upregulated genes in Lbh−/− compared to Lbh+/+ OHCs. (E) ShinyGO biological processes enriched in downregulated genes in Lbh−/− compared to Lbh+/+ OHCs.

