FIGURE 3.

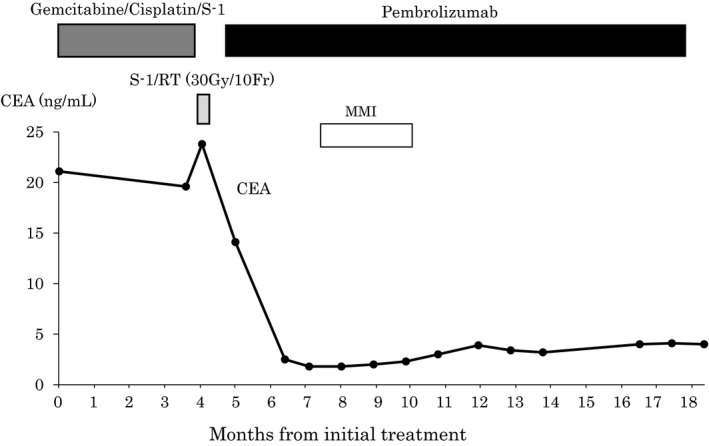
Clinical course. This graph demonstrates changes in the carcinoembryonic antigen level (CEA) level and the timeline from initial treatment

Clinical course. This graph demonstrates changes in the carcinoembryonic antigen level (CEA) level and the timeline from initial treatment