Fig. 1.
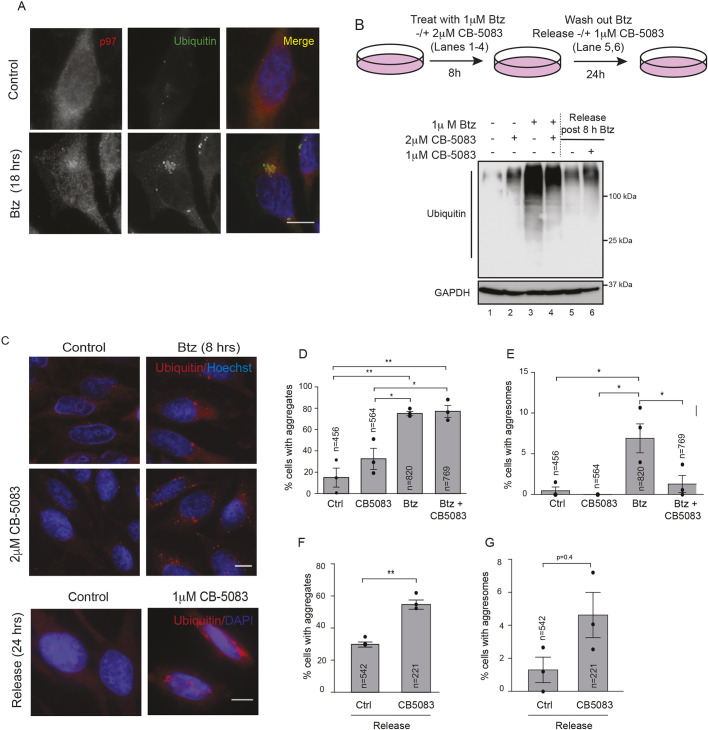
p97 is required for aggresome formation and clearance. (A) HeLa Flp-in T-Rex cells were treated with 1 µM Btz for 18 h. Cells were stained for p97, ubiquitin (FK2) and nuclei (Hoechst dye). (B) Hela Flp-in T-Rex cells were treated with 1 µM Btz, 2 µM CB-5083 or both for 8 h. Cells were released into drug-free medium or medium containing 1 µM CB-5083 for 24 h. Cell lysates were probed for ubiquitin. (C) Cells were treated as in B and imaged for ubiquitin-positive aggregates and aggresomes. (D) The percentage of cells with cellular aggregates (encompassing cytosolic and perinuclear aggregates) was quantified using AggreCount for images as in C. (E) The percentage of cells with perinuclear aggresomes (minimum size cutoff 2 µm2) was quantified using AggreCount for the images as in C. (F) The percentage of cells with cellular aggregates (encompassing cytosolic and perinuclear aggregates) in the release samples were quantified using AggreCount for images as in C. (G) The percentage of cells with perinuclear aggresomes in release samples were quantified using AggreCount for the images as in C. The black dot represents the mean from each biological replicate. The indicated number of cells (n) analyzed from all three independent biological replicates is shown for each condition. Graphs show the mean±s.e.m. *P≤0.05, **P≤0.01 as determined by one-way ANOVA with Bonferroni corrections (D,E) or an unpaired Student's t-test (F,G). Scale bars: 10 µm.

