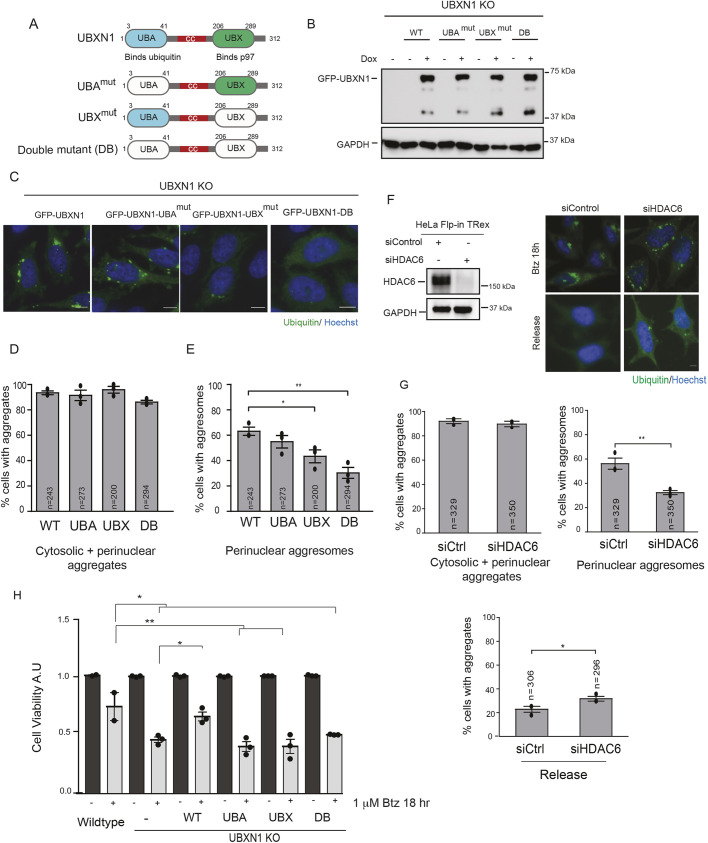
Fig. 5.
Analysis of domains within UBXN1 that are necessary for aggresome formation. (A) Domain organization of UBXN1 showing N-terminal ubiquitin associated domain (UBA), coiled coil domain (cc) and C-terminal ubiquitin X domain (UBX). (B) Expression of GFP–UBXN1, GFP–UBXN1-UBAmut, GFP–UBXN1-UBXmut and the double mutant (DB) in the UBXN1 KO cell line induced by the addition of doxycycline for 72 h. (C) UBXN1 KO cells expressing GFP–UBXN1 wild-type (WT), GFP–UBXN1-UBAmut, GFP–UBXN1-UBXmut and GFP–UBXN1-DB were treated with 1 µM Btz for 18 h and stained for ubiquitin. Re-expression of WT UBXN1 but not the single mutants or double mutant rescued aggresome formation. The UBAmut has smaller aggresomes but did not reach significance. (D) The percentage of cells with aggregates (encompassing cytosolic and perinuclear aggregates) were quantified for images as in C. (E) The percentage of cells with perinuclear aggresomes were quantified for the images as in C. (F) The depletion of HDAC6 inhibits aggresome formation and clearance in HeLa Flp-in TRex cells treated with 1 µM Btz for 18 h. Left panel shows knockdown of HDAC6. (G) Quantification of images in F. (H) WT, UBXN1 KO (and indicated rescue lines) and NPL4 cell lines were plated in triplicate into 96-well plates and treated with 1 µM Btz for 18 h. Cell viability was measured and normalized to the value of untreated controls for each cell line. The black dot represents the mean from each biological replicate. The indicated number of cells (n) analyzed from all three independent biological replicates is shown for each condition. Graphs show the mean±s.e.m. for panels in D, E and G and mean±s.d. of panel H. *P≤0.05, **P≤0.01 as determined by one-way ANOVA with Bonferroni correction (D,E) or Dunnett's multiple comparison test (H), or unpaired Student's t-test (G). Scale bars: 10 µm.

