Fig. 3.
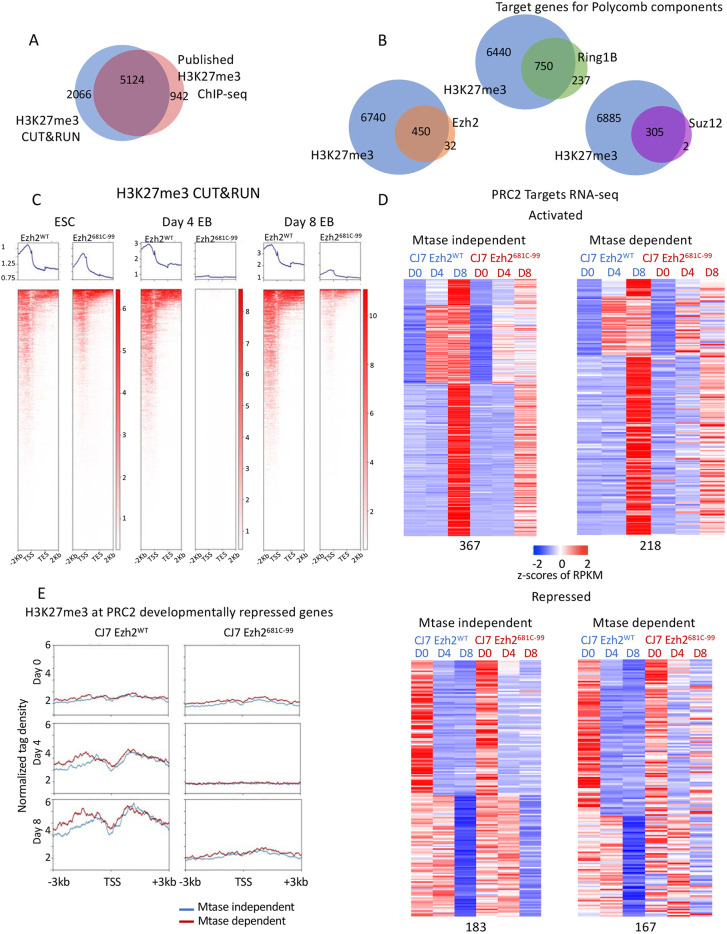
The 681C point mutant shows reduced H3K27me3 on target genes regardless of whether they are dependent on the modification for normal expression. (A) Venn diagram showing overlap of H3K27me3 CUT&RUN and published ChIP-seq data peaks. (B) Venn diagrams showing overlap of target genes of H3K27me3 and other PRC2 components by CUT&RUN. (C) Average profiles and individual gene profiles of 7190 PRC2 target genes showing H3K27me3 CUT&RUN signal at day 0, 4 and 8 in WT and mutant cells. (D) Heatmap showing expression patterns of methyltransferase (Mtase)-dependent and -independent PRC2 target genes in WT and mutant ESCs over developmental time course. z-Scores of average RPKMs of triplicates are shown for each gene across all samples. Genes are separated based on whether they were activated (upper panels) or repressed (bottom panels) in WT cells over time as well as whether they had a similar expression pattern in mutant cells (Mtase-dependent genes; right) or a different expression pattern (Mtase-independent genes; left). The four groups are further clustered based on fold changes over time in untreated cells. All of the classifications were made based on a 1.5-fold change cutoff in expression levels over time. (E) Average profiles showing H3K27me3 enrichment in WT and mutant cells by CUT&RUN at Mtase-dependent (167) or -independent (183) and developmentally repressed PRC2 target genes over the time course.

