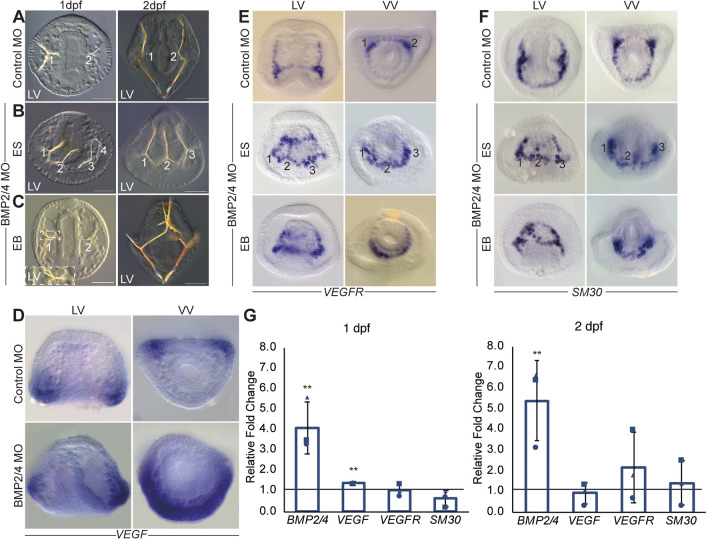
Fig. 2.
BMP2/4 control skeletal patterning and VEGF expression. (A) Embryos injected with control MO show two normal spicules at 1 dpf (left, 110/110 of scored embryos show this phenotype) and 2 dpf (right, 56/56). (B,C) BMP2/4 MO-injected embryos show either ectopic spicules indicated by numbers (ES, 89/169 1 dpf, 120/135 2 dpf) or ectopic spicule branching (EB, 39/169 at 1 dpf, 15/135 at 2 dpf). Scale bars: 50 μm in A-C. (D) VEGF expression is localized in two lateral patches in the control embryo (top) and is strongly expanded in embryos injected with BMP2/4 MO at 1 dpf (bottom). (E,F) VEGFR and SM30 expression in control embryo (top) and in BMP2/4 morphants (middle and bottom) at 1 dpf. BMP2/4 MO leads to the expansion of the expression either into ectopic skeletal cell clusters indicated by numbers (ES) or to continuous expansion (EB). LV, lateral view; VV, ventral view. Phenotypes are based on n≥3 independent biological replicates and spatial expression was observed in two independent biological replicates where n≥30 embryos were scored in each condition. (G) Ratio between gene expression in BMP2/4 MO compared with control MO embryos at 1 dpf (left graph) and 2 dpf (right graph). Bars show averages and markers indicate individual measurements of three independent biological replicates. Line indicates a ratio of 1, i.e. the expression of the gene is unaffected by the perturbation. Error bars indicate s.d. Statistical significance was calculated using a one-tailed z-test (**P<0.01).

