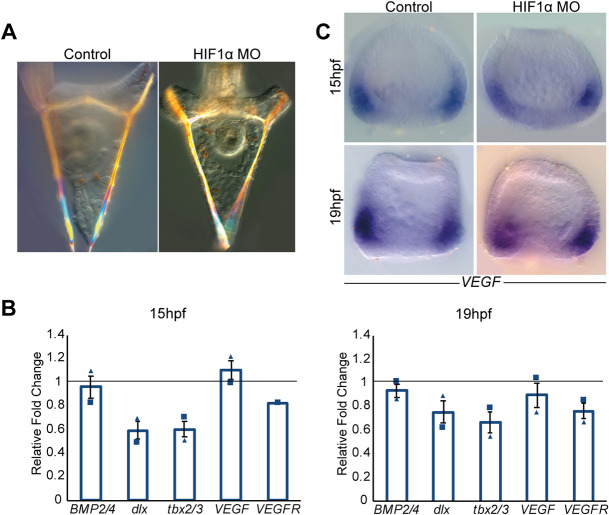
Fig. 3.
Sea urchin HIF1α does not affect skeletal patterning and VEGF expression. (A) Control (left) and HIF1α MO-injected embryos (right) show comparable skeletal structure at 2 dpf. (B) Ratio between gene expression in HIF1α MO compared with control MO embryos at 15 hpf (left graph) and 19 hpf (right graph). Bars show averages and markers indicate individual measurements of two independent biological replicates. Line indicates a ratio of 1, i.e. the expression of the gene is unaffected by the perturbation. Error bars indicate s.d. (C) VEGF expression is similar in embryos injected with control MO (left) and HIF1α MO (right) at 15 hpf (top) and 19 hpf (bottom). Spatial expression was observed in two independent biological replicates where n≥30 embryos were scored in each condition.

