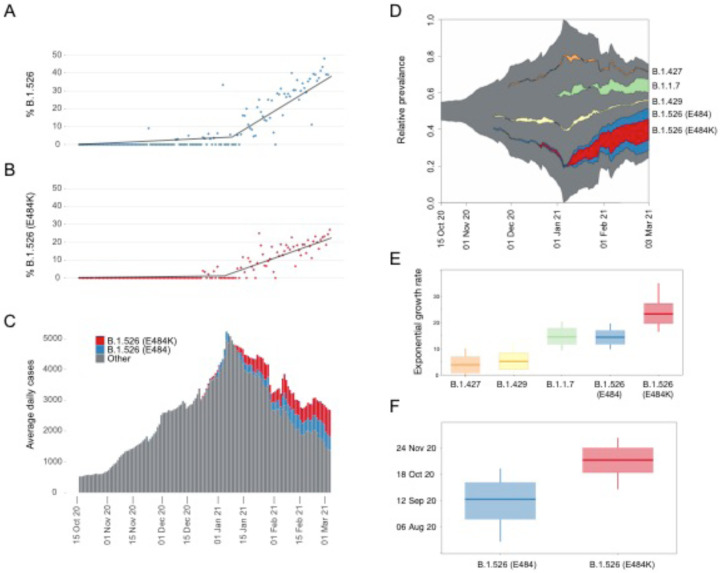
Figure 3.
Rise of SARS-CoV-2 variants in New York City (NYC) in late-2020 and early 2021. (A) Relative frequency of B.1.526. Segmented linear regression is shown as a solid black line. (B) Relative frequency of B.1.526 with E484K mutation. Segmented linear regression is shown as a dashed gray line. (C) Rolling average number of total daily COVID-19 cases in NYC through time. Color indicates the estimated proportions of B.1.526 (blue) and B.1.526 E484K (red) extrapolated from a 7-day rolling average with an average of n=236 genomes sampled per week during this time period. (D) Muller plot depicting sampling, with pseudocounts, of SARS-CoV-2 variants scaled to the rolling average of total daily COVID-19 case counts. (E) Inferred exponential growth rates for SARS-CoV-2 variants in NYC; the horizontal line indicates the median growth rate estimate, the box outlines the interquartile range. (F) Inferred time of most recent common ancestor (TMRCA) estimates for B.1.526 (E484) and B.1.526 (E484K).

