Figure 3.
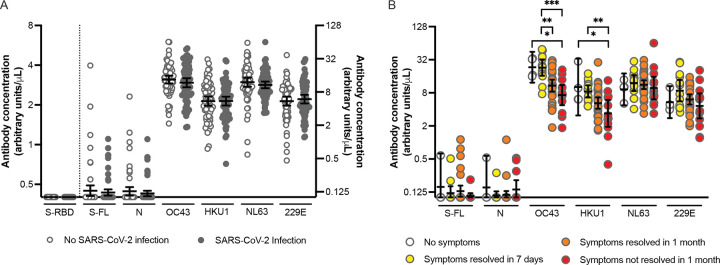
Correlation between pre-existing antibody concentrations and reported SARS-CoV-2 infections and duration of COVID-19 symptoms. (A) Pre-existing antibody concentrations in health care workers with (n=68) and without (n=68) SARS-CoV-2 infection after last blood draw. The control group without SARS-CoV-2 infection after last blood draw was matched to the infection group based on age and sex. Antibody concentrations were similar between infected and uninfected individuals (p>0.28 in unpaired t-tests using log2-transformed antibody concentrations). Antibody concentrations specific to S-RBD are projected on the left Y-axis and values below the cutoff (0.48) are set at 0.40. All other antibody concentrations are projected on the right Y-axis. And values below the limit of detection (0.20) are set at 0.10. Horizontal lines show the geometric mean concentrations and 95% confidence intervals. (B) Pre-existing antibody concentrations in health care workers who reported a PCR-confirmed SARS-CoV-2 infection and had no symptoms (n=4) or indicated symptom duration via an online survey (n=58). Symptom duration was grouped symptoms resolved within 7 days (n=13), symptoms resolved within 1 month (n=32) and symptoms not resolved within 1 month (n=13). Significant p-values (<0.05) are indicated above the graph (one-way ANOVA using log2-transformed antibody concentrations). Horizontal lines show the geometric mean concentrations and 95% confidence intervals. * p<0.05; ** p<0.01; *** p<0.001.

