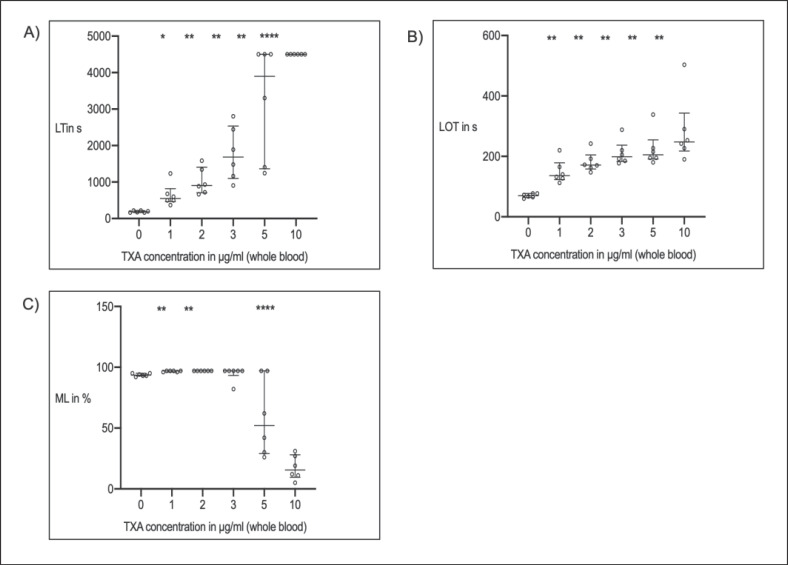
Fig. 2.
In vitro, dose-effect curves of thromboelastometric variables (median + IQR; n = 25) and increasing whole-blood concentrations of tranexamic acid (TXA). A Lysis time (LTTPA-test) = time span between CT and 50% lysis. B Lysis onset time (LOTTPA-test) = time span from clotting time to 15% lysis. C Maximum lysis (MLTPA-test) = difference between MCF and lowest amplitude in % of MCF. * p < 0.05 vs. baseline (before TXA); ** p < 0.01 vs. baseline; *** p < 0.001 vs. baseline; **** p < 0.0001 vs. baseline.

