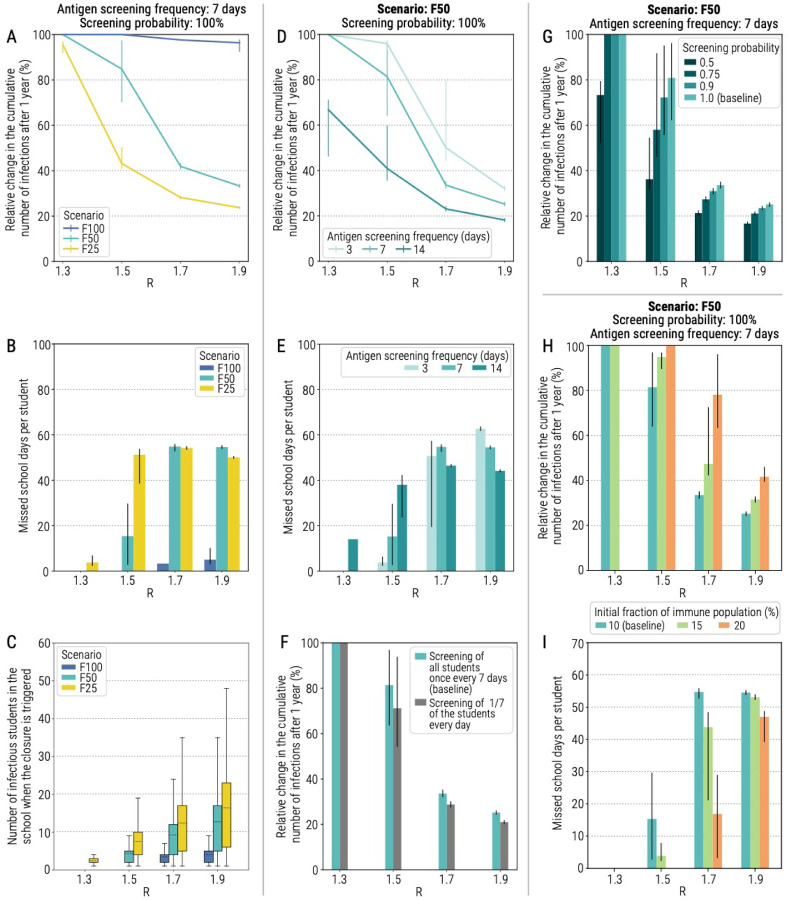
Figure 4. Impact of reactive class-closure policy relying on antigen screening.
A Relative change in the cumulative number of infections after one year as a function of the reproduction number and for different scenarios about school transmission contribution. The line corresponds to the mean value, while the vertical line represents the 95% quantile intervals; colors refer to the three scenarios F25, F50, F100. The fraction of immune population at the beginning of epidemic is set at 10%, the probability of testing a student at school with the antigen test is 100%, the frequency of the antigen testing is weekly; other parameters are as the baseline values reported in Tab. S1 and S2. Note that R is estimated in the absence of the class-closure strategy. The relative change is defined as the estimated number of infections after 1 year since the introduction of the first infected individual without the implementation of the class-closure strategy minus the one with the class-closure strategy implemented, relative to the estimated number without the implementation of the class-closure strategy. Note that, to exclude spontaneous extinctions from the analysis, only simulations leading to a final infection attack rate of 5% or higher after 1 simulated year are considered. B Number of missed school days per student due to the reactive class-closure strategy. The bar corresponds to the mean value, while the vertical line represents 95% quantile intervals. Note that, if no simulations lead to an epidemic with infection attack rate ≥5% for a given combination of model parameters, the number of missed school days is set to 0 by definition. C Number of infectious students in a school at the time when the class closure is triggered. D As A, but for scenario F50 and by varying the frequency of testing (every 3, 7 or 14 days). E As B, but for scenario F50 and varying frequency of testing (every 3, 7 or 14 days). F Relative change in the cumulative number of infections after one year as a function of the reproduction number when all students are tested in one day, once per week, or when 1/7 of the students at each school are tested every day. G As A, but for scenario F50 and by varying the probability of antigen testing (50%, 75%, 90%, and 100%). The bar corresponds to the mean value, while the vertical line represents 95% quantile intervals. H As A, but for scenario F50 and by varying the fraction of immune population at the beginning of the simulation (10%, 15%, and 20%). The bar corresponds to the mean value, while the vertical line represents 95% quantile intervals. I As B, but for scenario F50 and by varying the fraction of immune population at the beginning of the simulation (10%, 15%, and 20%).

