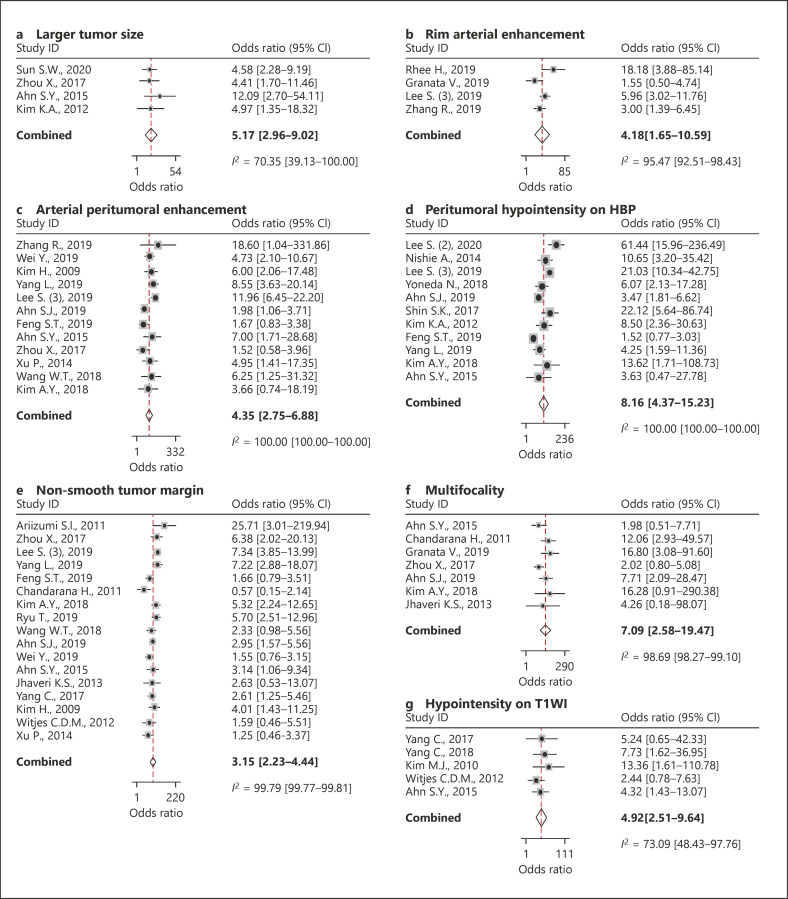
Fig. 3.
Forest plots of the DORs of larger tumor size (>5 cm) (a), rim arterial enhancement (b), arterial peritumoral enhancement (c), peritumoral hypointensity on HBP (d), nonsmooth tumor margin (e), multifocality (f), and hypointensity on T1WI (g). DORs, diagnostic odds ratio; HBP, hepatobiliary phase imaging; T1WI, T1-weighted imaging.

