Figure 2.

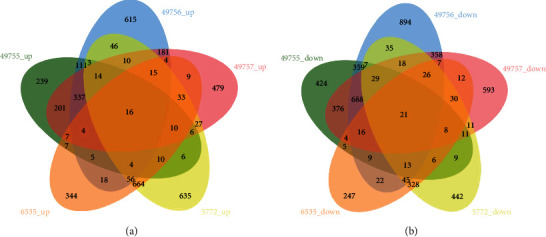
Summary of the differentially expressed genes in candidate datasets. (a) Up- and (b) downregulated genes were screened out between sepsis and controls, as shown in the Venn diagram.

Summary of the differentially expressed genes in candidate datasets. (a) Up- and (b) downregulated genes were screened out between sepsis and controls, as shown in the Venn diagram.