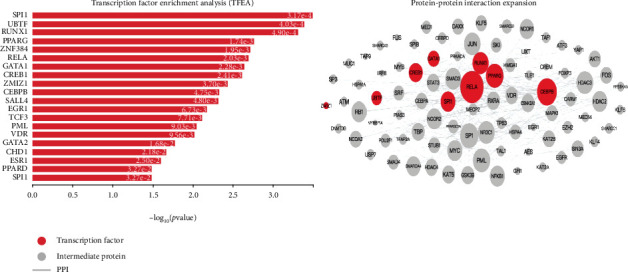
Figure 6.

Upstream regulatory networks predicted to regulate the expression of the coregulated gene signatures in sepsis vs. the normal controls, as inferred from the Expression2Kinases (X2K) analysis. The inferred networks contain transcription factors (TFs, red nodes) and intermediate proteins (gray nodes). Gray edges indicate the interaction between two proteins (PPI). The size of nodes is relative to the level of expression degree.
