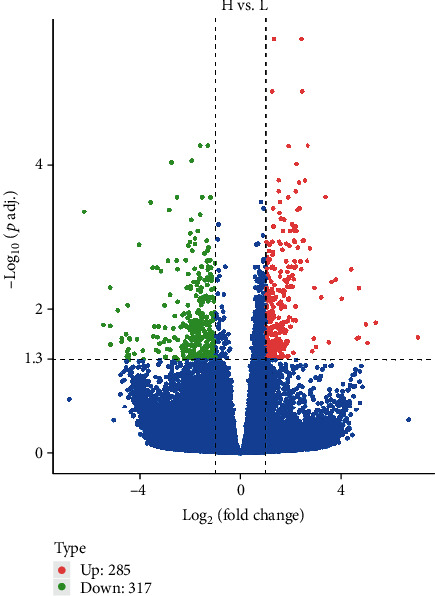
Figure 2.

Volcano plot of the total expression of genes in both the H and L groups. The x-axis represents the log2(fold change) values for gene expression, and the y-axis represents the -log10(P value) (padj in the figure represents the P value; P < 0.5 indicates −log10(padj) > 1.3). Each dot represents a gene identified from the RNA-seq data. Red dots indicate 285 upregulated DEGs, green dots indicate 317 downregulated DEGs, and blue dots indicate 30,915 nondifferentially expressed genes.
