Figure 6.

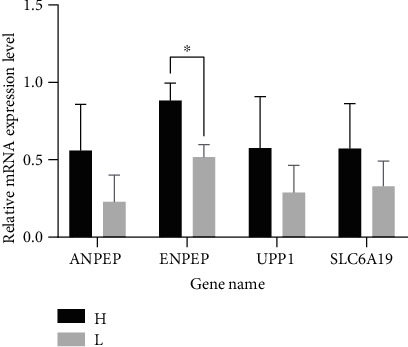
Validation of 4 DEGs between the H and L ducks by RT-qPCR. The x-axis denotes the DEGs name, and the y-axis denotes the log2 fold change derived from RT-qPCR.

Validation of 4 DEGs between the H and L ducks by RT-qPCR. The x-axis denotes the DEGs name, and the y-axis denotes the log2 fold change derived from RT-qPCR.