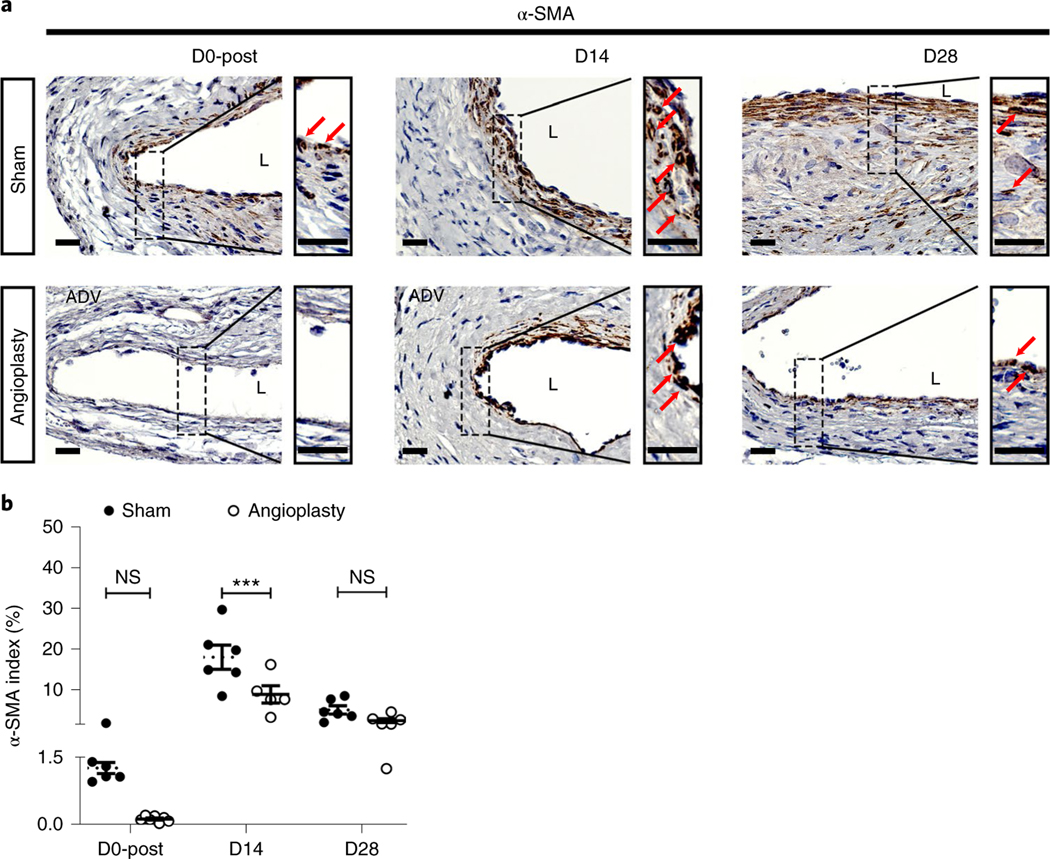
Fig. 4 |. Immunostaining for smooth muscle cells (α-SMA+ cells) at different time points.
a, Representative α-SMA staining of sham- and angioplasty-treated vessels at D0-post, D14 and D28. At D0-post, there are rare α-SMA+ cells in the vessel wall. More α-SMA+ cells can be seen in the sham vessels compared to angioplasty-treated vessels, located in the neointimal and media areas at D14 and D28. b Semiquantitative analysis shows a significant decrease in α-SMA index in angioplasty-treated vessels compared to sham controls at D14, with no difference at D28. Each time point represents the mean ± s.e.m. of five to seven animals for each group. Two-way ANOVA with Bonferroni’s correction was performed by Graph Pad Prism version 8 (GraphPad Software Inc.). Significant differences are indicated: ***P < 0.001. Red solid arrows indicate positive cells. Scale bars: 25 μm. ADV, adventitia; L, lumen; NS, not significant.

