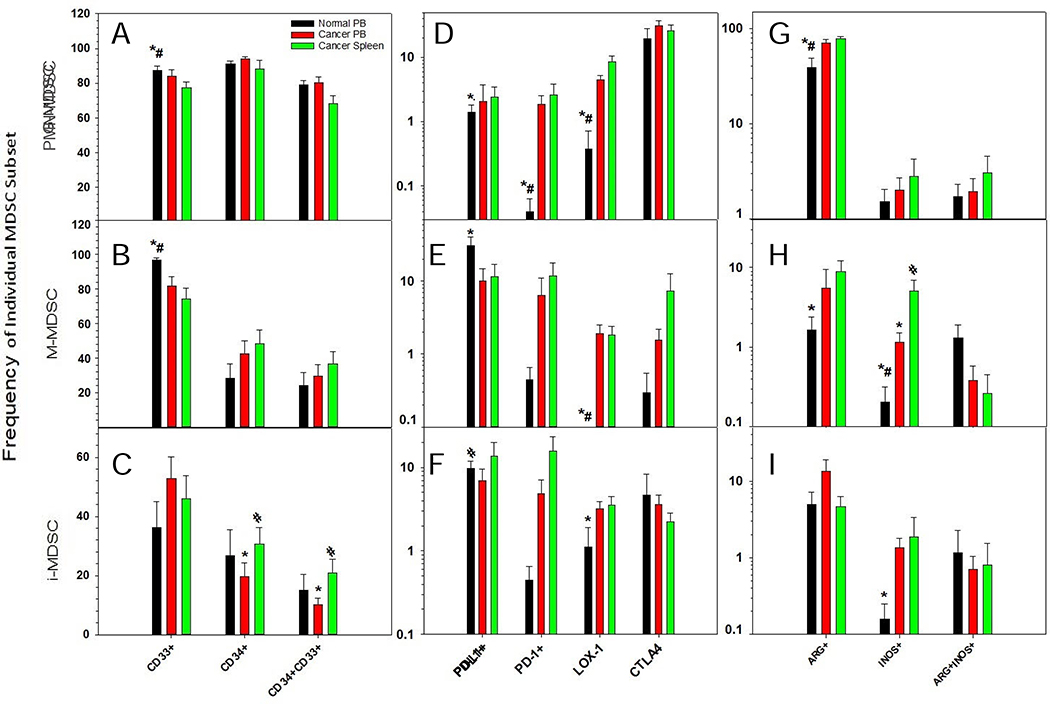
Figure 3. Expression of activation, myeloid and functional markers on MDSCs.
Reported as the frequency of each individual MDSC subset, based on the expression of activation (D-F), myeloid (A-C), and functional markers (G-I). This is shown for PMN- (A,D,G), M- (B,E,H) and i-(C,F,I) MDSCs in normal peripheral blood (PB), cancer PB, and cancer patient’s spleen cells. The Benjamini-Hochberg (BH) procedure was used with a false discover rate of 0.05 to correct for multiple comparisons. Significance was determined by an independent T-test with BH adjusted p-value<0.05; * significant difference to cancer spleen, # significant difference to cancer PB.

