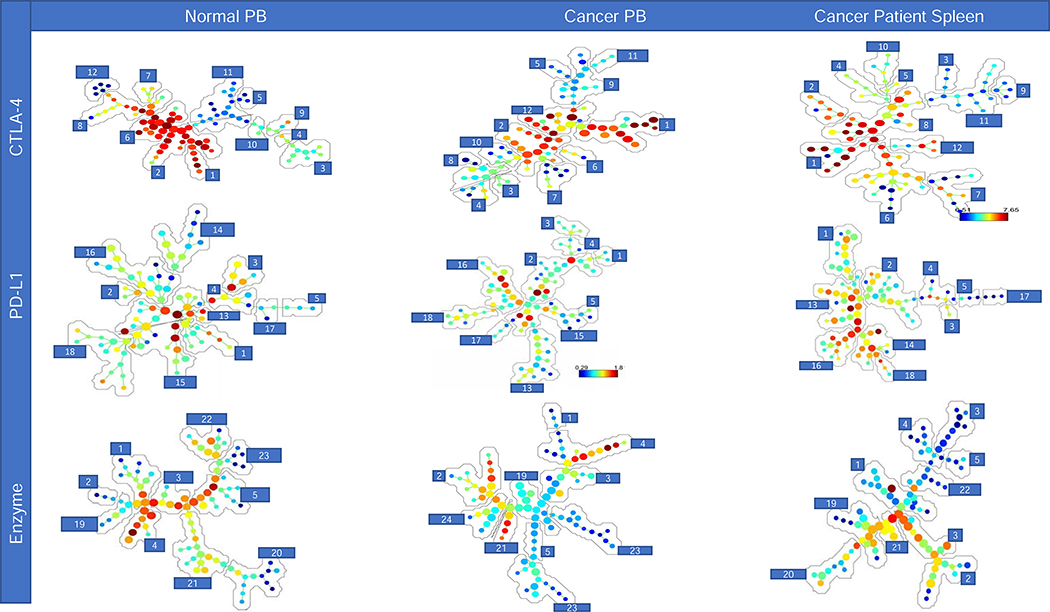
Figure 5. SPADE analysis of each sample type and panel.
SPADE trees and annotations for the peripheral blood (PB) of normal donors and cancer patients, and cancer patients spleens for all three flow panels (CTLA-4, PD-L1, and enzyme); reported as cell frequency from exported total MDSC population. Annotations 1–5 are representative of cell clusters consistently found for all sample types (Table 3). Annotations 6–12, 13–18, and 19–24 (Table 4) are representative of MDSC subpopulations identified in each sample type and source for flow panels CTLA-4, PD-L1, and enzyme respectively.

