
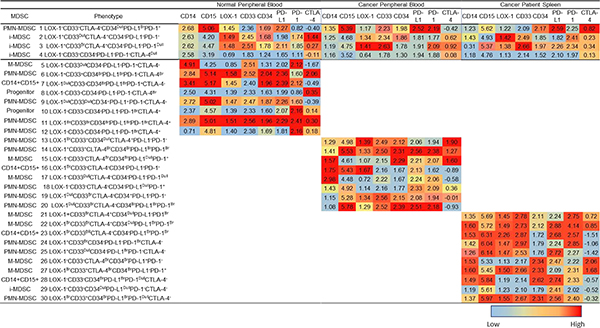
Table 5.
Numerically denoted phenotypic marker expression from CytoBackBone analysis of the myeloid derived suppressor cell (MDSC) subpopulations in the peripheral blood (PB) of normal donors and cancer patients, and cancer patients’ spleens (Fig. 6). Annotations 1–4 are representative of clusters consistently identified in all sample types and sources (Table 5). Annotations 5–12, 13–20, and 21–30 are representative of MDSC subpopulations identified in the PB of normal donors, and the PB and spleen cells of cancer patients, respectively (Table 5). Relative phenotypic marker expression is shown for the merged CTLA-4 and PD-L1 flow panels and ranges from low (blue) to high (red). The median and range of the phenotypic marker expression can be references in ST 4.
 |