Fig. 5.
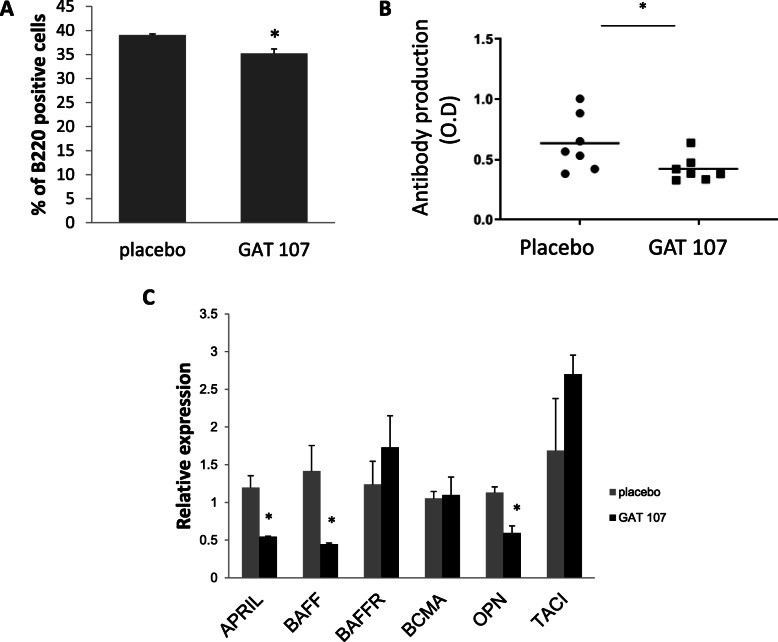
Level of B cell markers following GAT107 treatment. a Reduction in B200-positive cells following GAT107 treatment (n = 3) (*p < 0.05). b Reduction in anti-MOG35–55 antibodies following GAT107 treatment. The serum antibody levels were detected with ELISA, as described in the “Methods”. Results are expressed as the mean of two separate experiments ± SE (n = 7) (*p < 0.05). c mRNA levels of APRIL, BAFF, BAFF-R, BCMA, CXCL13, OPN, and TACI were detected by RT-PCR at day 9 after EAE induction and following ex vivo reactivation with the MOG peptide. The results expressed as mean relative quantification value ± SE of two separate experiments (n = 5, *p < 0.05)

