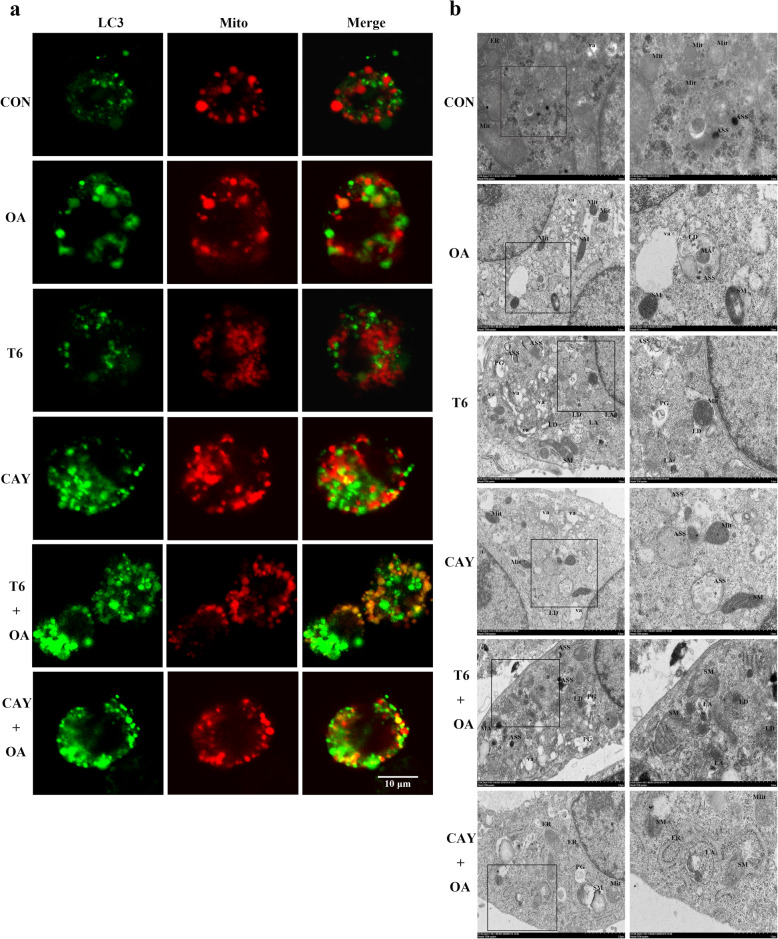
Fig. 4.
SIRT-1 involved in regulation of mitochondrial autophagy and lipophages in HepG2 cells. The cells were pretreated with T6 (2 μM) or CAY (20 μM) 2 h, followed incubated with OA (1.5 mM) for 48 h. a Mitochondrial autophagosome was determined. Red: mitochondria; green: LC3; yellow/ orange: merge. Scale bars are 10 μm respectively. b Representative electron micrographs of cells. Mit: mitochondria; SM: swollen and ruptured mitochondria; ER: endoplasmic reticulum; ASS: autophagolysosome; PG: phagophore; va: vacuole; LD: lipid drops; LA: lipid component of autolysosome. Scalar bar = 2.0 μm and 1.0 μm

