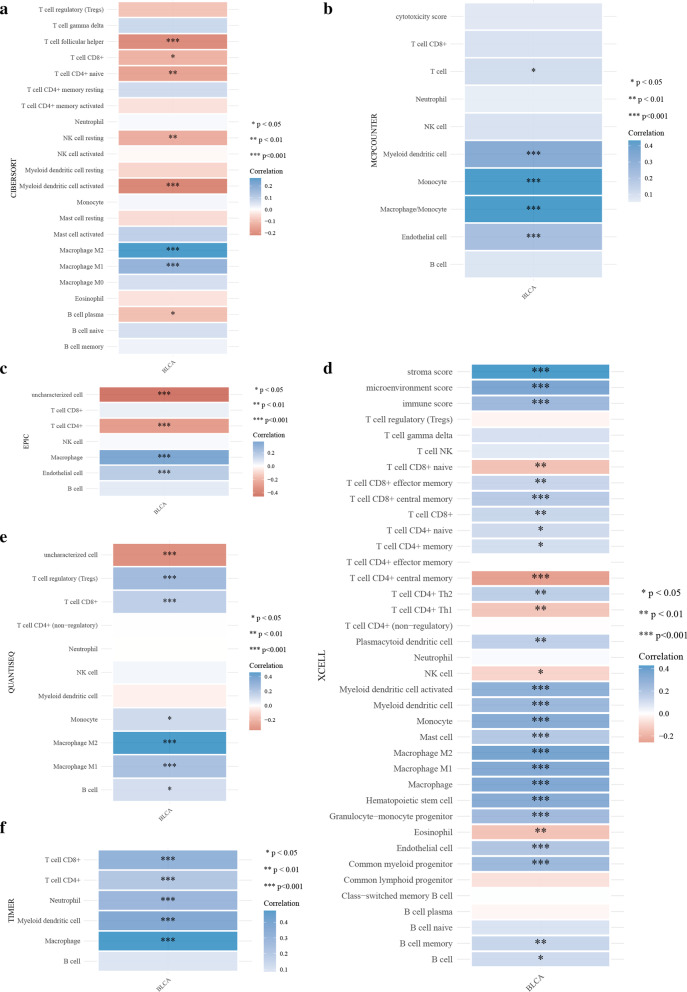
Fig. 5.
Relationship between EPDR1 expression and TIICs A-F: Immune score evaluation by TIMER, xCell, MCP-counter, CIBERSORT, EPIC, and quanTIseq: Different colors represent correlation coefficients, the horizontal and vertical coordinates represent genes, and different colors represent correlation coefficients (In the diagram, red represents positive correlation, blue represents negative correlation), and the darker the color represents the two stronger correlation. Asterisks represent levels of significance (*p < 0.05, **p < 0.01,***p < 0.001)

