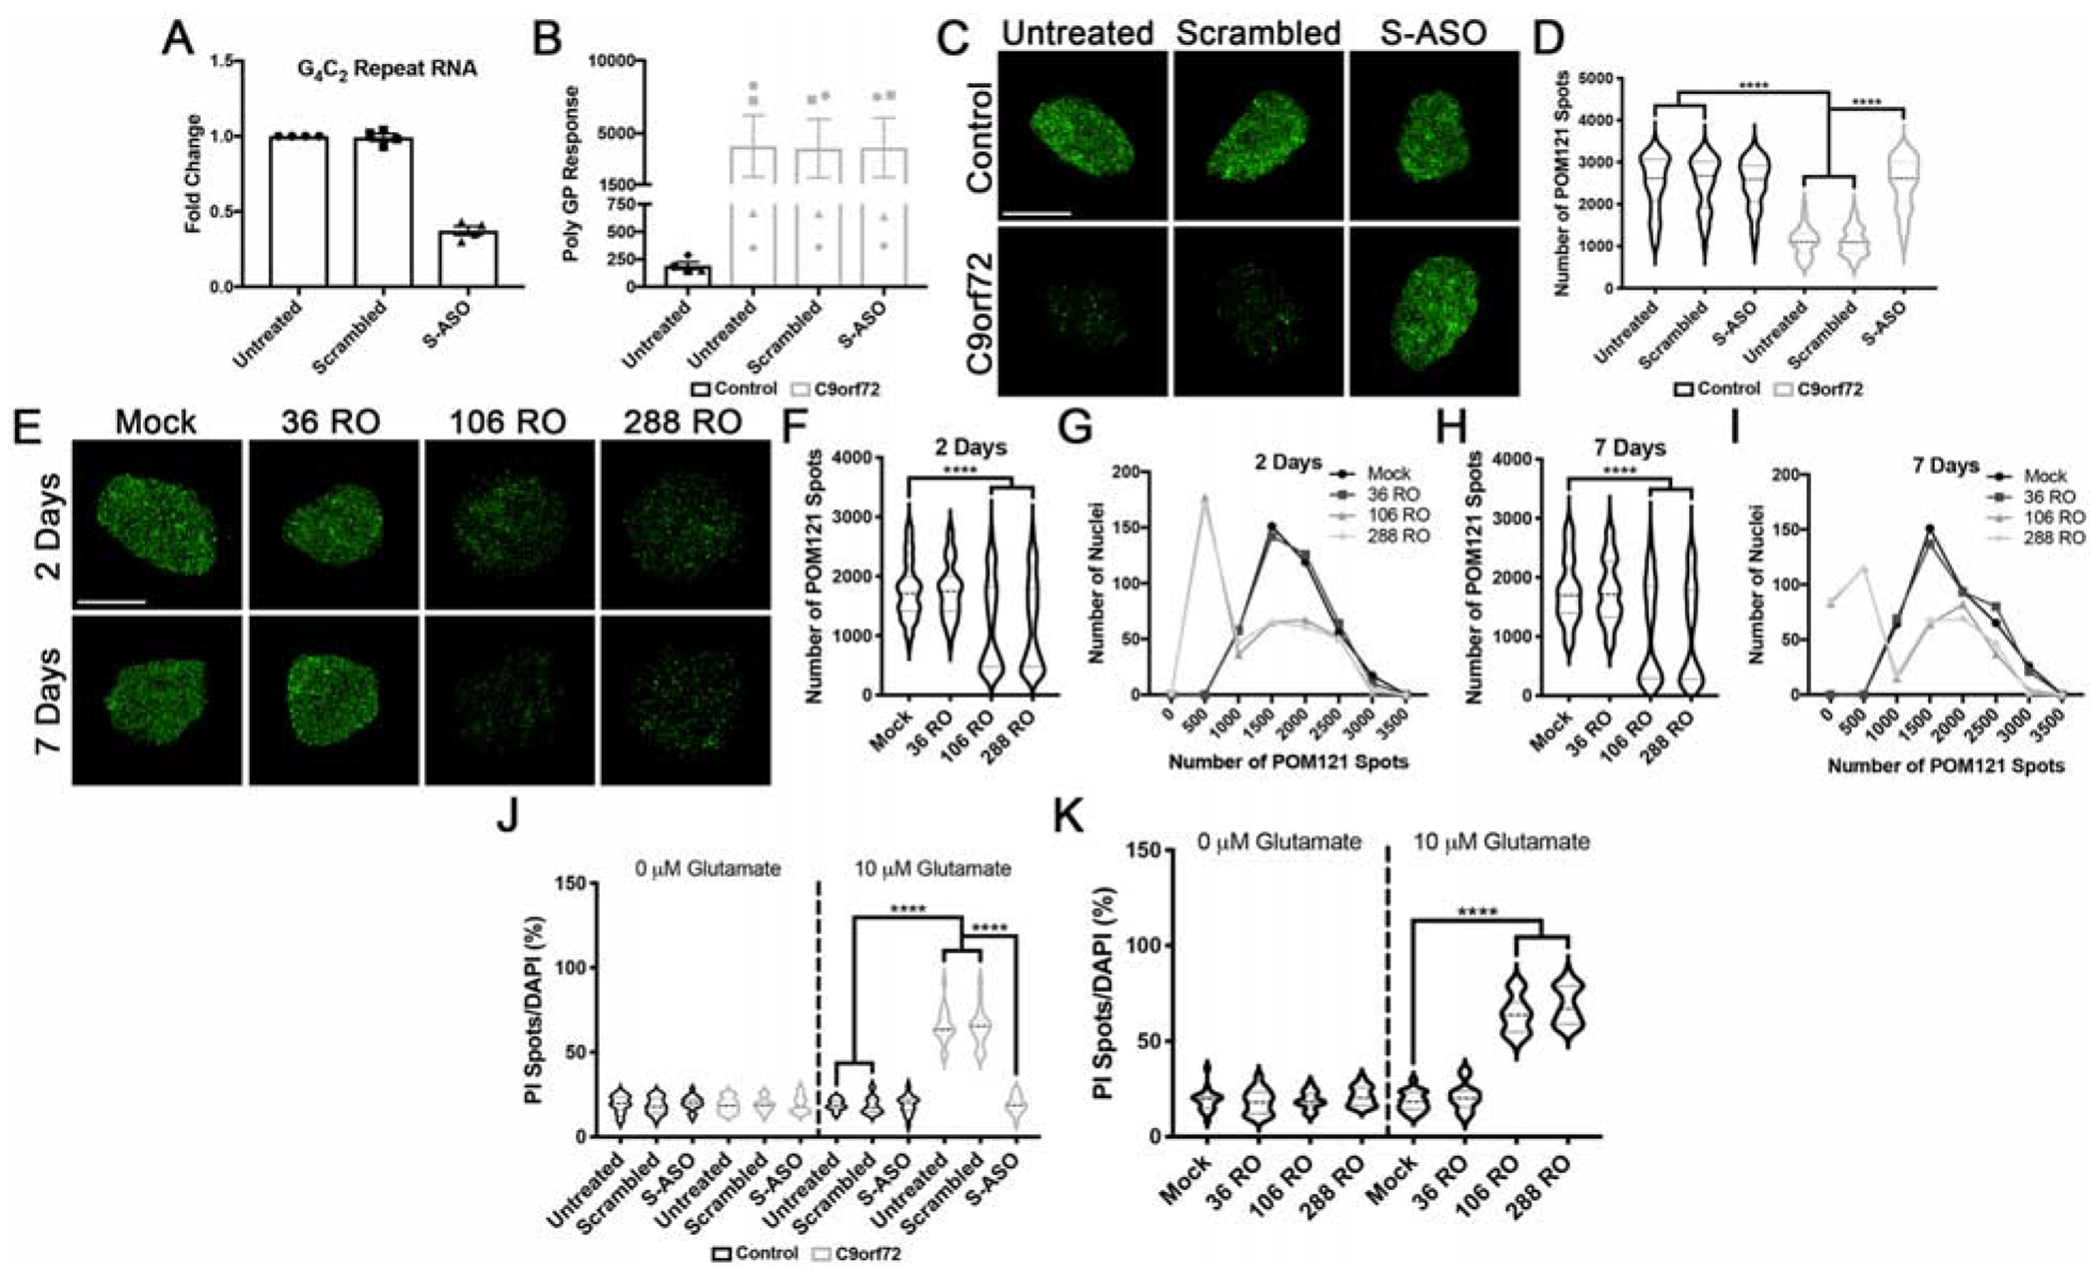
Figure 7. Expression of pathologic G4C2 repeat RNA initiates the nuclear reduction in POM121.

(A-B) RT-qPCR for G4C2 repeat RNA (A) and MSD Elisa for Poly(GP) DPR levels (B) in C9orf72 iPSNs following 5 days of treatment with G4C2 targeting ASO. (C) SIM imaging for POM121 in nuclei isolated from control and C9orf72 iPSNs. Genotype as indicated on left, treatment as indicated on top. (D) Quantification of percent total nuclear volume occupied by POM121 following 5 days of treatment with G4C2 targeting ASO. N = 4 control and 4 C9orf72 IPSC lines, 50 NeuN+ nuclei per line/treatment. Two-way ANOVA with Tukey’s multiple comparison test was used to calculate statistical significance. **** p < 0.0001. (E) Maximum intensity projections from SIM imaging of POM121 in nuclei isolated from wildtype iPSNs overexpressing 36, 106, or 288 G4C2 RNA repeats. Time point as indicated on left, overexpression as indicated on top. (F-I) Quantification and histogram distributions of POM121 spots 2 days (F-G) and 7 days (H-I) after overexpression of G4C2 repeat RNA. N = 4 wildtype iPSC lines, 100 NeuN+ nuclei per line/overexpression. One-way ANOVA with Tukey’s multiple comparison test was used to calculate statistical significance. **** p < 0.0001. (J) Quantification of percent cell death following exposure to glutamate in iPSNs treated with ASOs for 5 days. N = 4 control and 4 C9orf72 iPSC lines, 10 frames per well. Two-way ANOVA with Tukey’s multiple comparison test was used to calculate statistical significance. **** p < 0.0001. (K) Quantification of percent cell death following exposure to glutamate in wildtype iPSNs overexpressing G4C2 repeat RNA. N = 4 control iPSC lines, 10 frames per well. Two-way ANOVA with Tukey’s multiple comparison test was used to calculate statistical significance. **** p < 0.0001. Scale bar = 5 μm.
