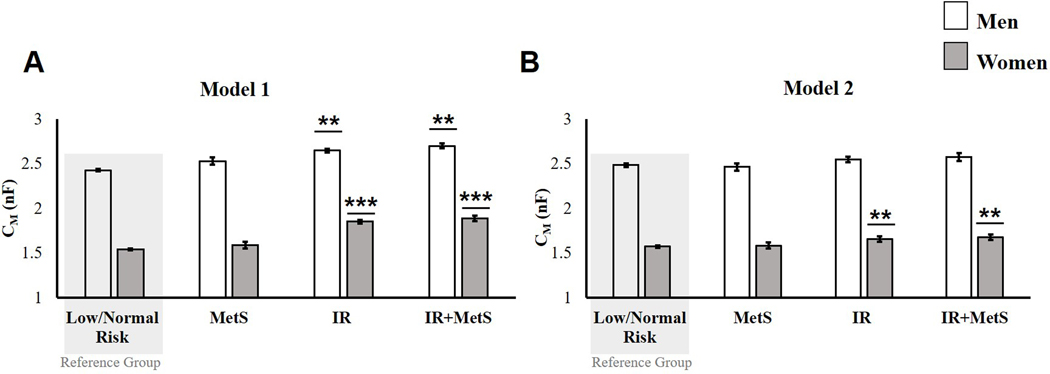
Figure 1.
ANCOVA comparing the membrane capacitance (CM) of women and men with low/no CMD risk (reference groups) to those in groups with increased CMD risk: metabolic syndrome (MetS), insulin resistance (IR), and insulin resistance and metabolic syndrome (IR + MetS). A) Model 1 adjusted for height2and intracellular resistance (RI); and B) Model 2 adjusted for height2, RI, age, African-American race/ethnicity, Mexican American race/ethnicity, DXA lean massǂ, DXA fat massǂ, medication use, smoking, and alcohol use.
Data are expressed as the least-squares adjusted mean ± standard error.
**p < 0.001 versus the low/no-risk group; *** p < 0.0001 versus the low/no-risk
ǂ variable is log-transformed.
Abbreviations: nF, nanoFarads; DXA, Dual-x-ray-absorptiometry.

