
Fig. 2.
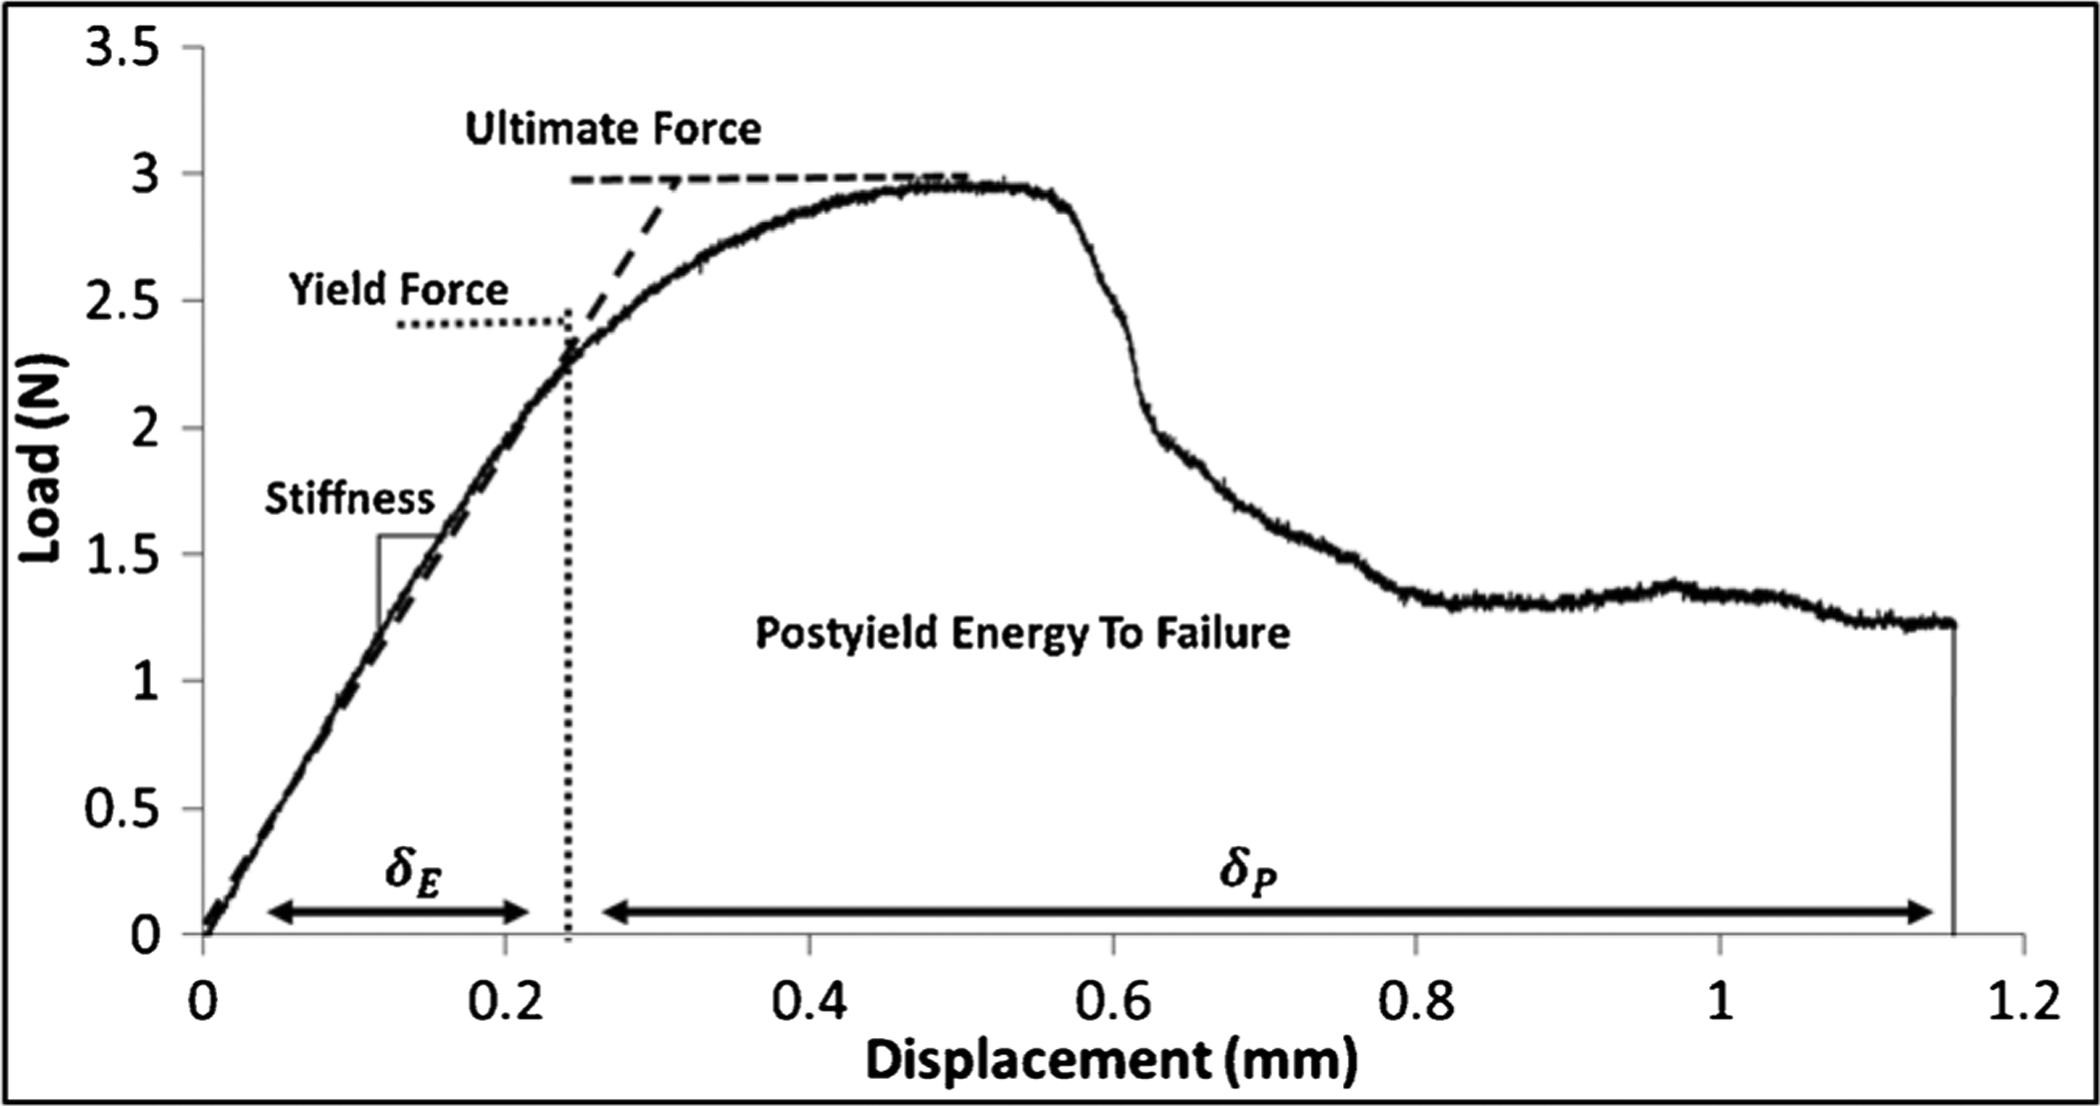
Representative load-displacement curve generated from a mouse radius 3-point bending test. The post-yield energy to failure is defined as the area under the curve after the yield point. Elastic and plastic deformations are indicated by δE and δP, respectively