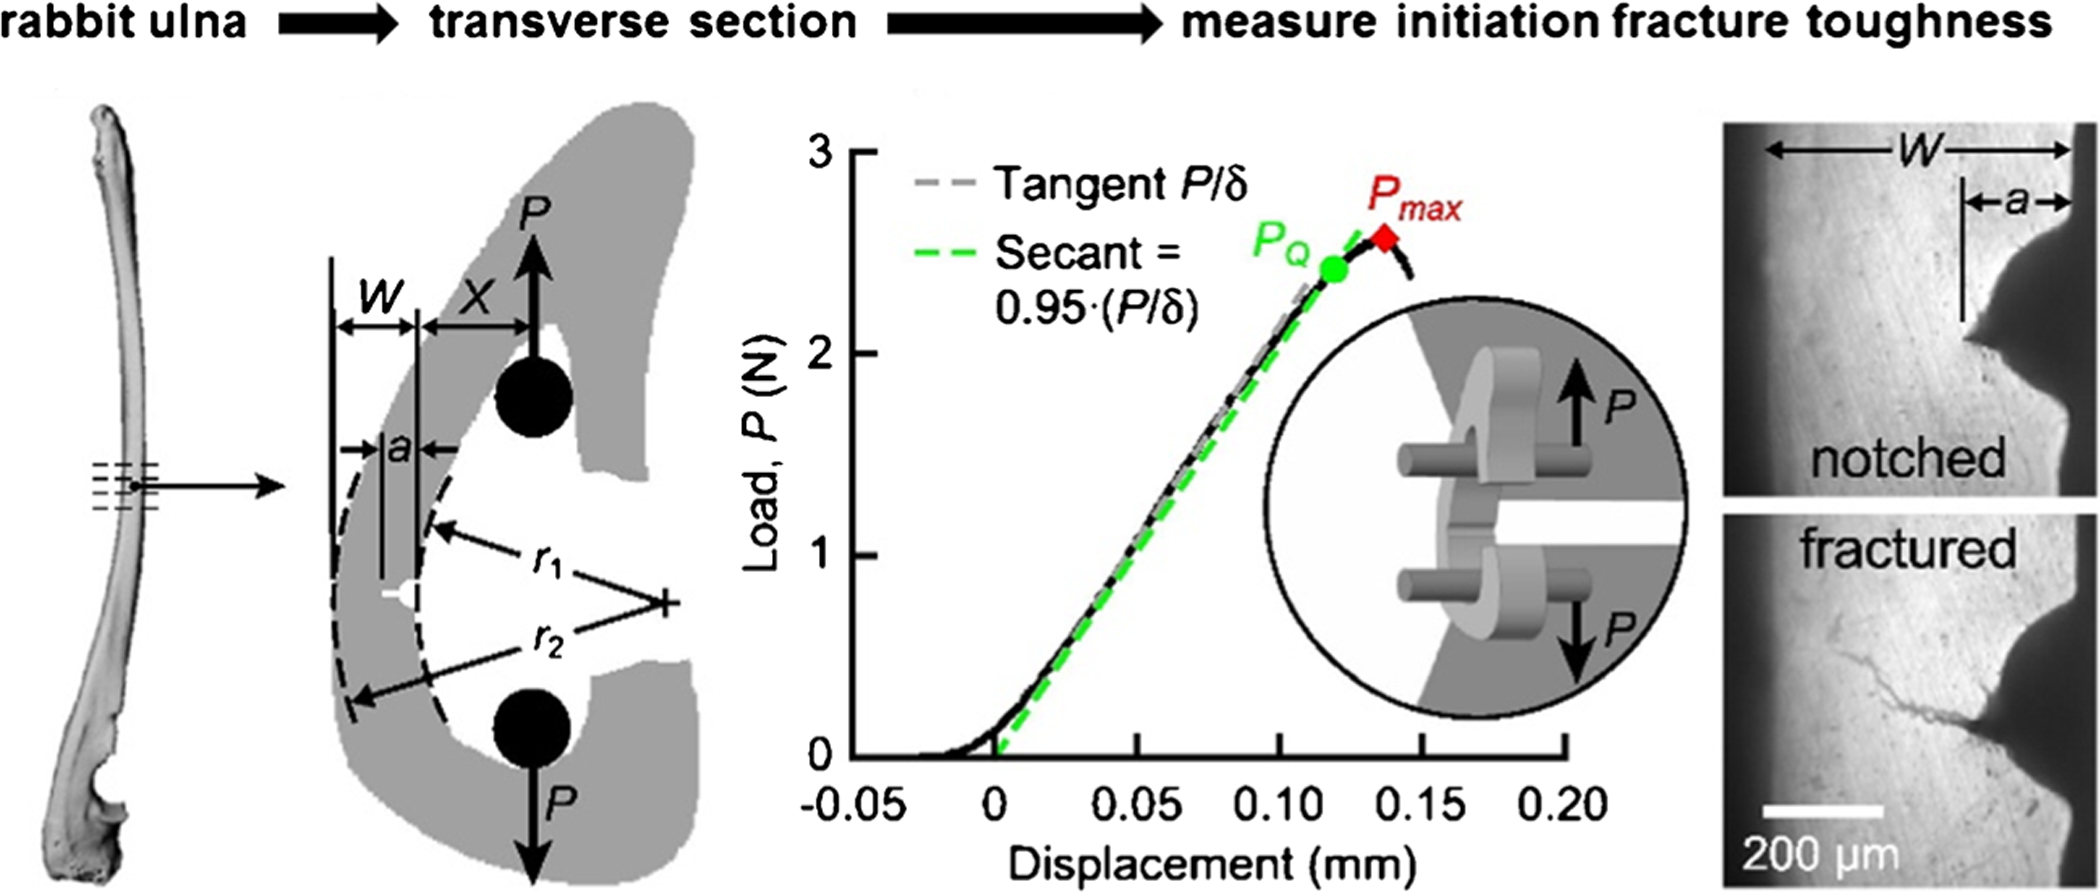
Fig. 3.

Schematic of arc-shaped tension specimen from the mid-diaphysis of rabbit ulnae. Micro-CT images were used to measure cross-sectional geometry. The measurement of notch depth, cortical width, as well as verification of radial crack propagation at the notch tip was done using optical micrographs. A custom fixture was used to load specimens via two hardened steel pins. The representative load-displacement curve shows the conditional load, PQ, and maximum load (Pmax), used for the calculation of fracture toughness. The radial fracture toughness was measured in multiple replicates per bone. Adopted from Hunckler et al. [51•] with permission obtained from Elsevier
