Fig. 4.
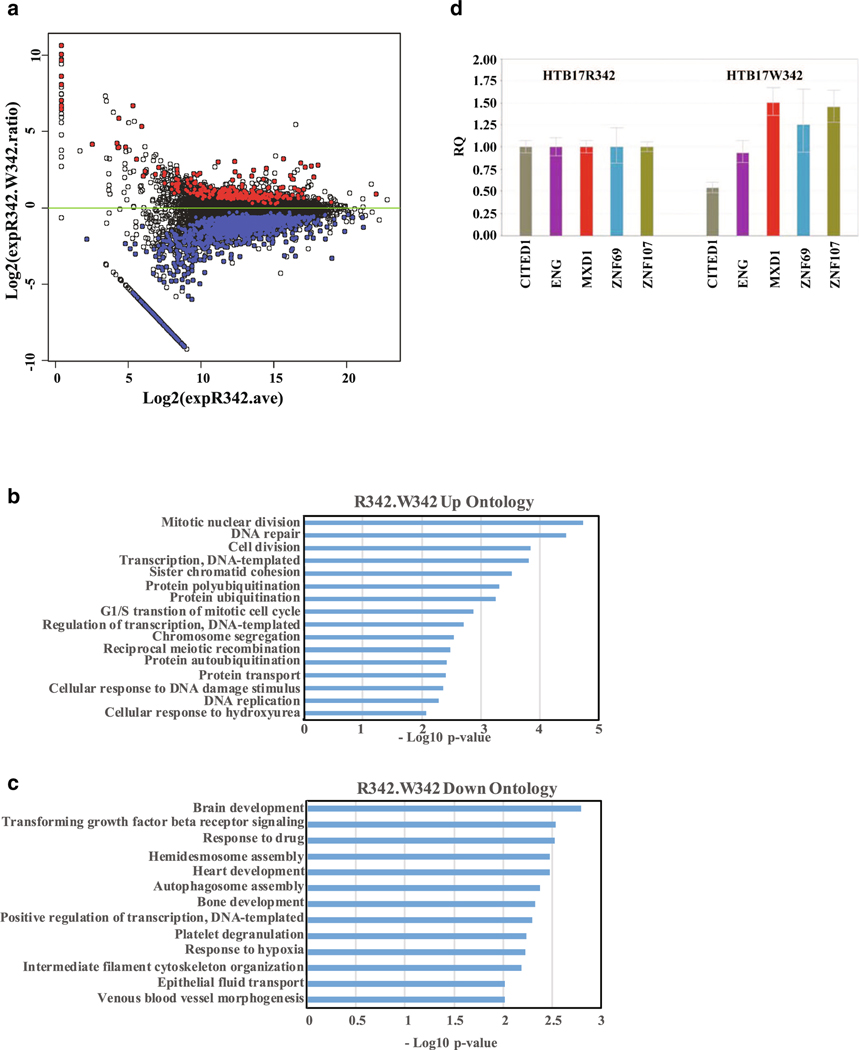
Gene expression profiling of W342 mutant in HTB17 cells by RNA seq analysis. a The log2 fold-change in RNA level with the W342 mutant relative to CtBP R342 is plotted against the log2 total expression level in CtBP R342 cells. Expression values are total normalized nucleotide coverage per gene. Red dots indicate genes that are expressed at higher levels in W342 mutant cells than in wt CtBP cells (q≤ 0.05) and blue indicates genes that are expressed at lower levels. The RNA seq results were submitted to data bank, and the geo accession number is GSE126253. b Biological process ontology analysis of genes expressed at higher levels in W342 cells. c Biological process gene ontology analysis of genes expressed at lower levels in W342 cells. d Examples of upregulated and down regulated genes. Reference control used in this experiment is HTB17CtBP1 RNA

