Fig. 6.
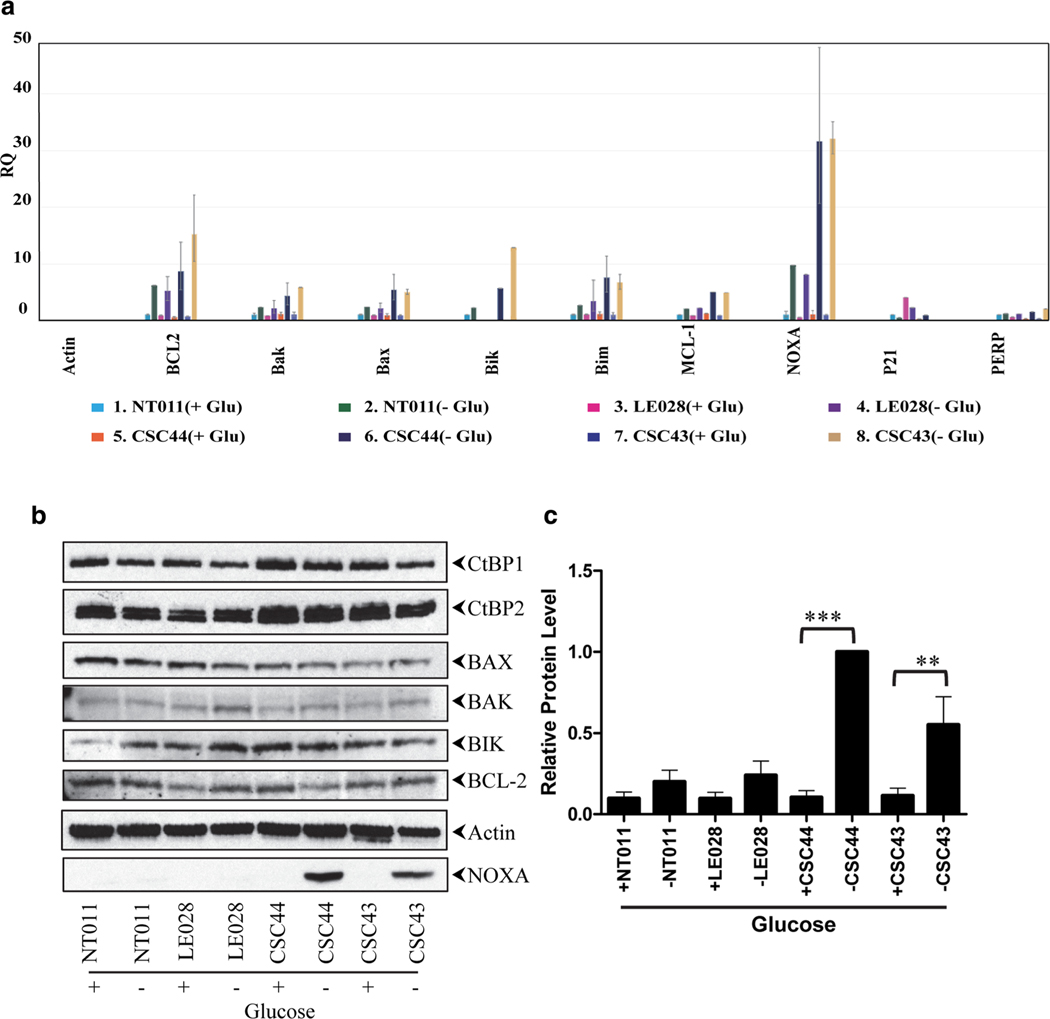
Effect of glucose deprivation on the expression of apoptotic and anti-apoptotic genes. a RNA analysis by RT-qPCR. The experiment was carried out in triplicate and the relative quantification (RQ) values are plotted. Reference control used in this experiment is NT011(+ Glu)RNA. b Western blot analysis of apoptosis-related proteins. To detect NOXA, cell extracts were immunoprecipitated and analyzed by Western blotting. + indicates cells in glucose media. – indicates cells in media lacking glucose. The experiment was repeated 3 times and quantitated the relative protein level using Image Studio Lite software, LI-COR Biosciences (c). The relative level of expression of NOXA in CSC44 cells in medium lacking glucose is normalized to 1.0. The P values were determined by comparing the expression of NOXA in the presence and absence of glucose in growth medium: **P < 0.01, ***P < 0.001

