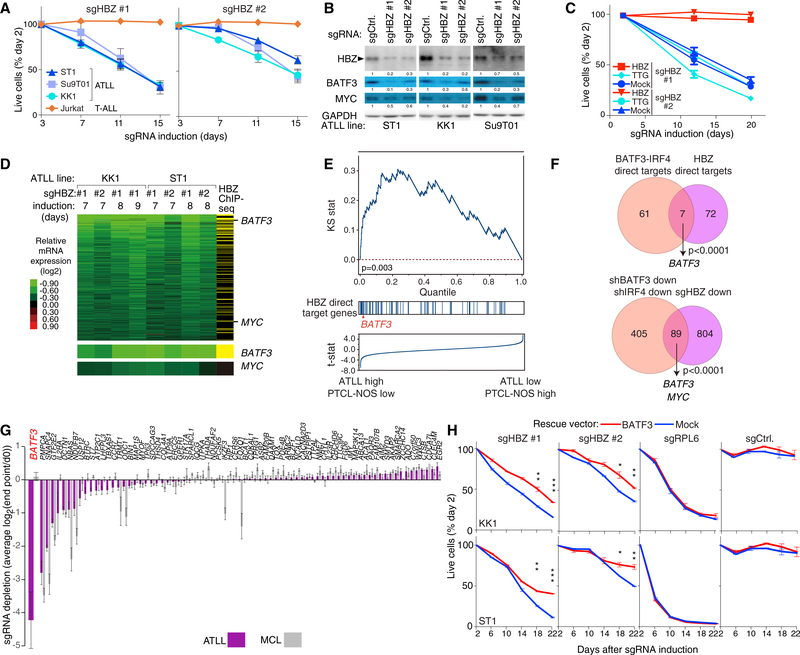
Figure 3. HBZ Drives BATF3 Expression in ATLL.
(A) The indicated cell lines were infected with a retrovirus that expresses sgHBZ #1 or sgHBZ #2 together with GFP. Shown is the fraction of GFP-positive cells relative to the GFP-positive fraction on day 3. Error bars represent the SEM of replicates (at least three).
(B) Immunoblot analysis of the indicated proteins after 6 days of induction of sgHBZ #1 or sgHBZ #2 in the indicated cell lines. Quantification of HBZ, BATF3 and MYC immunoblot bands, normalized to GAPDH and compared with shCtrl, is shown.
(C) KK1 cells were transduced with retroviruses expressing an sgRNA-resistant HBZ isoform, with retroviruses expressing TTG-HBZ or with empty vector, and were subsequently transduced with retroviruses co-expressing GFP and either sgHBZ #1 or sgHBZ #2. The GFP-positive cell fraction was monitored as in Figure 1C. Error bars represent the SEM of quadruplicates.
(D) Heatmap of relative mRNA expression levels of 894 genes that were downregulated by log2 fold change of less than −0.3 in more than 4 of 8 HBZ-knockout KK1 and ST1 ATLL cells, according to the color scale shown. Yellow bars in the far right column indicate genes with biotagHBZ-ChIP-seq peaks within a promoter region gene window (see Figure 2B legend). Log2 fold changes of BATF3 and MYC mRNA expression are shown at the bottom.
(E) Gene set enrichment analysis of HBZ direct target genes in mRNA expression data from primary T cell lymphoma biopsies. Genes were ranked according to the T statistic shown for their relative mRNA expression in ATLL and PTCL-NOS samples. The distribution of HBZ direct target genes, as defined in (D), is shown.
(F) Venn diagram of 68 direct target genes of BATF3 and IRF4 and 79 direct target genes of HBZ (top) or of genes that are downregulated following knockdown of BATF3 or IRF4 and those downregulated by HBZ inactivation in ATLL (bottom).
(G) HBZ direct target genes were ranked based on their essentiality quantified as average log2 fold change (day 0/endpoint; day 21 in MCL lines, and day 28 in ATLL lines) of all replicates of all corresponding sgRNAs in CRISPR/Cas9-mediated screening. Three ATLL cell lines (ST1, KK1, and Su9T01) or two MCL cell lines (Jeko and UPN1) were analyzed. Error bars represent the SEM of replicates.
(H) ATLL lines were transduced with retroviruses expressing BATF3, and subsequently with retroviruses co-expressing GFP and the indicated shRNAs. The GFP-positive cell fraction was monitored as in Figure 1C. Results are shown as means ±SEM (n = 2). *p < 0.05, **p < 0.01, ***p < 0.001.

