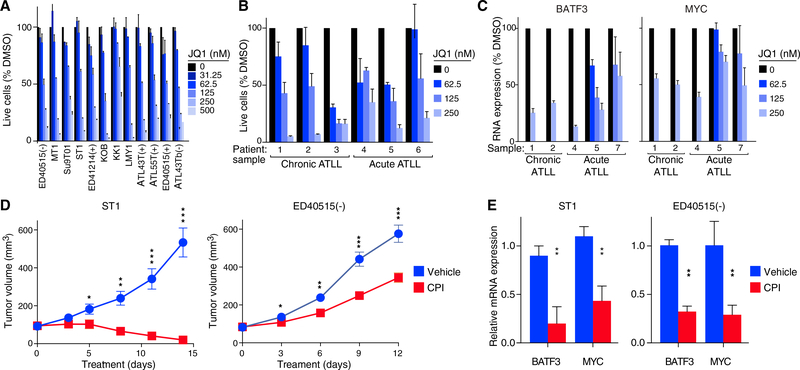
Figure 5. Toxicity of BET Protein Inhibitors for ATLL Cells In Vitro and In Vivo.
(A) Viable cells measured by the MTS assay for the indicated ATLL cell lines treated with the indicated concentrations of JQ1 for 4 days. Error bars show the SEM of duplicates.
(B) Viable cells were measured ([3H]thymidine incorporation assay) following JQ1 treatment at the indicated concentrations for 6 days (chronic subtype of ATLL) or for 3 days (acute subtype of ATLL). Error bars represent the SEM of triplicates.
(C) BATF3 and MYC mRNA expression quantified by qRT-PCR, normalized to HPRT1 mRNA expression, in primary ATLL cells treated with JQ1 for 24 hr at the indicated concentrations. Error bars represent the SEM of triplicates.
(D) ST1 and ED405151(−) ATLL cells were established as subcutaneous tumors (average 93 mm3 and 83 mm3) in immunodeficient mice, which were then treated daily for 14 days and 12 days, respectively, with CPI-203 (5 mg/kg/injection, twice a day) or vehicle control by intraperitoneal injection. Tumor growth was monitored as a function of tumor volume. Error bars show the SEM of 6 mice (ST1) and 7 mice (ED40515(−)) per group.
(E) BATF3 and MYC mRNA expression quantified by qRT-PCR, normalized to HPRT1 expression, in ST1 and ED40515(−) ATLL xenograft tumors harvested after daily treatment for 4 days (ST1) and 9 days (ED40515(−)) with CPI-203 (5 mg/kg/injection, twice a day) or with vehicle control by intraperitoneal injection. Error bars represent the SEM of triplicates.
*p < 0.05, **p < 0.01, ***p < 0.001. See also Figure S5.

