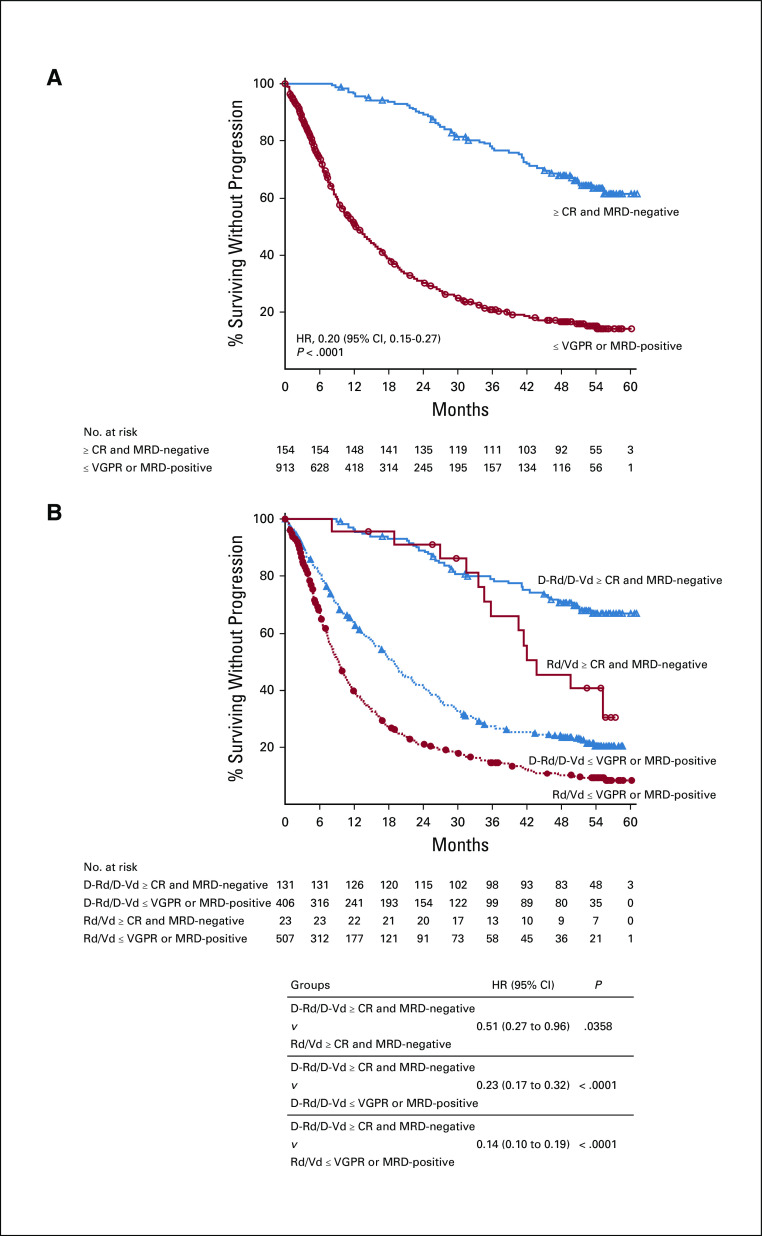
FIG 4.
PFS by response and MRD status (10−5) among (A) all patients in POLLUX and CASTOR and (B) in the pooled daratumumab-based combination groups versus control groups. Shown are the results of the Kaplan-Meier estimates of PFS among patients in the ITT population based on the absence of MRD at a threshold of one tumor cell per 105 white cells and on response category (≥ CR, ≤ VGPR). In panel A, blue line shows patients who achieve ≥ CR and MRD negativity at any time since random assignment; red line shows patients who achieve ≤ VGPR or are MRD-positive. In panel B, blue lines show regimens containing daratumumab; red lines show standard-of-care regimens. ≥ CR, complete response or better; D-Rd, daratumumab plus lenalidomide and dexamethasone; D-Vd, daratumumab plus bortezomib and dexamethasone; HR, hazard ratio; ITT, intention-to-treat; MRD, minimal residual disease; PFS, progression-free survival; Rd, lenalidomide and dexamethasone; Vd, bortezomib and dexamethasone; ≤ VGPR, very good partial response or worse.

