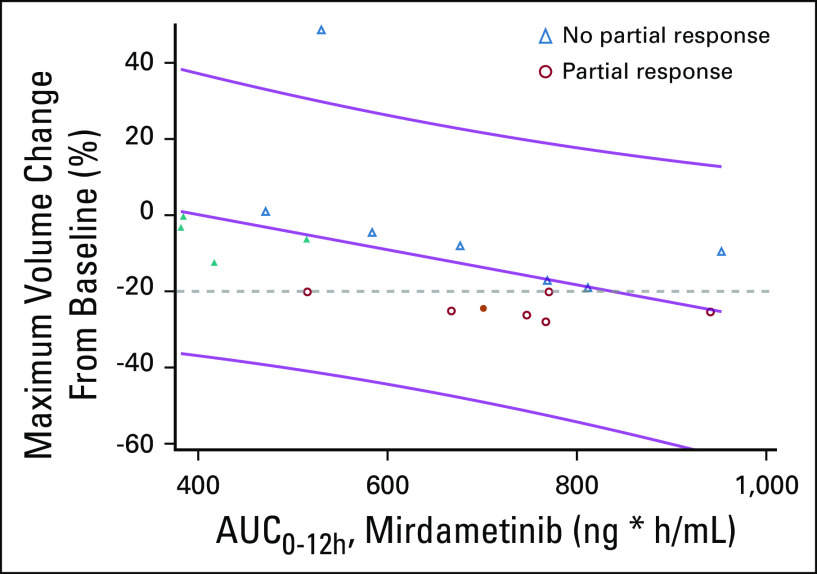
FIG 2.
Relationship between the maximum tumor volume change from baseline and the AUC0-12h estimate in steady state (R2 = 0.22; P = .052). The predicted exposure of mirdametinib at tumor size readout (as measured by AUC0-12h) was compared with maximum tumor volume change from baseline in individual patients using linear regression analysis. Blue triangles represent patients who did not achieve a partial response (PR). Red circles are those patients who did achieve a PR; one patient who achieved a PR did not have pharmacokinetics performed. Filled in shapes represent patients who had a dose reduction, only one of whom achieved a PR (although the dose reduction was after the PR was achieved). The patient near the very top of the graph had a small plexiform neurofibroma that significantly progressed in the first eight courses. AUC0-12h, area under the concentration-time curve from time 0 to 12 hours.

